Hi everyone,
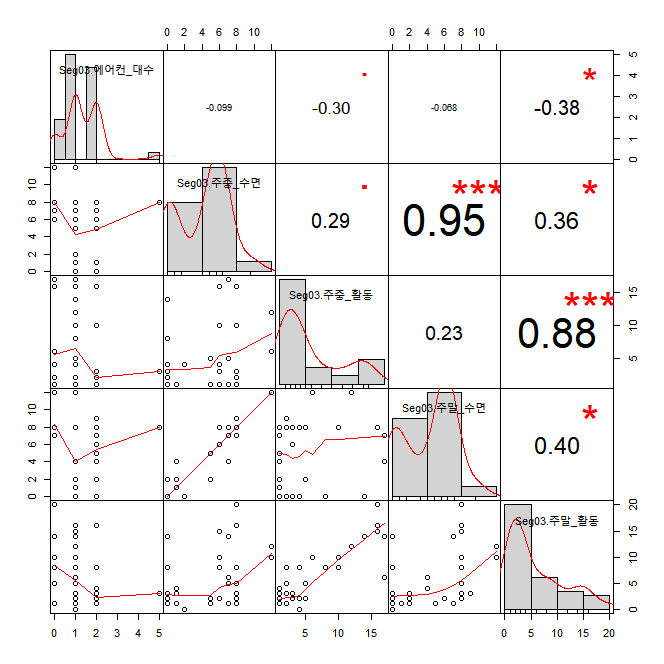
I have a correlation chart (example chart)created using Performance Analytics package. I want to replace dots with commas.
Pearson Coefficient 0.95
Desired format 0,95
Do you have any idea how to replace dot with a comma in all values of the chart?
Also I would like to know the significance of stars.
Signif <- symnum(test$p.value, corr = FALSE, na = FALSE, cutpoints = c(0, 0.001, 0.01, 0.05, 0.1, 1), symbols = c("***", "**", "*", ".", " "))
I would like *** p<0.01, ** p<0.05, * p<0.1* but I don't know how to modify the code.
Thank you so much!