Pivot_wider groups observations

Hi, I’m trying to use the function pivot_wider in order to have one column for Species and one column for each Plant Species.

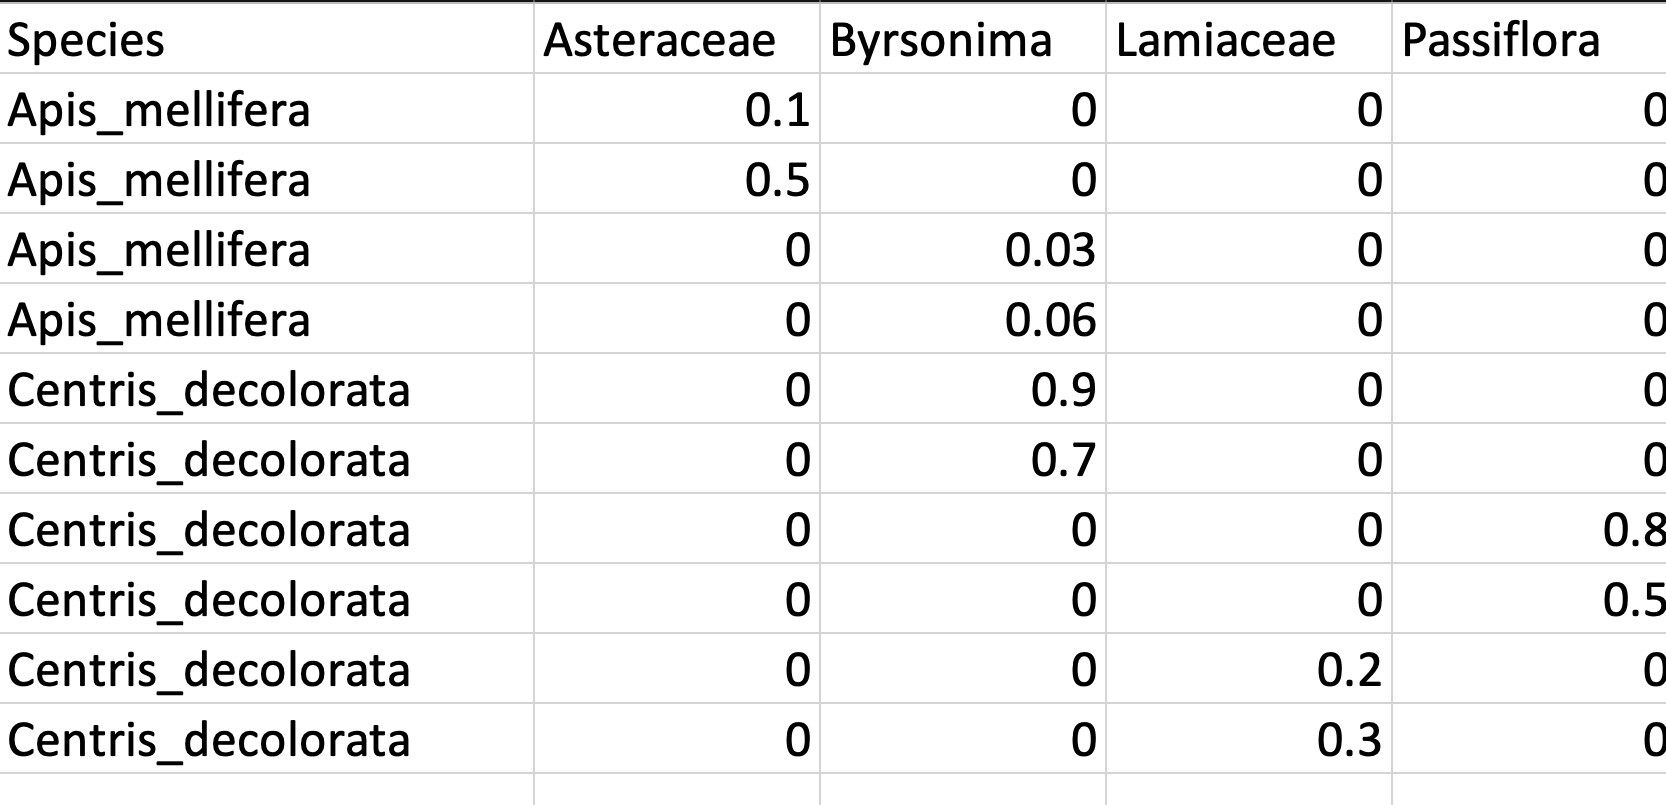
This is the data set:

This is the result of using pivot_wider:


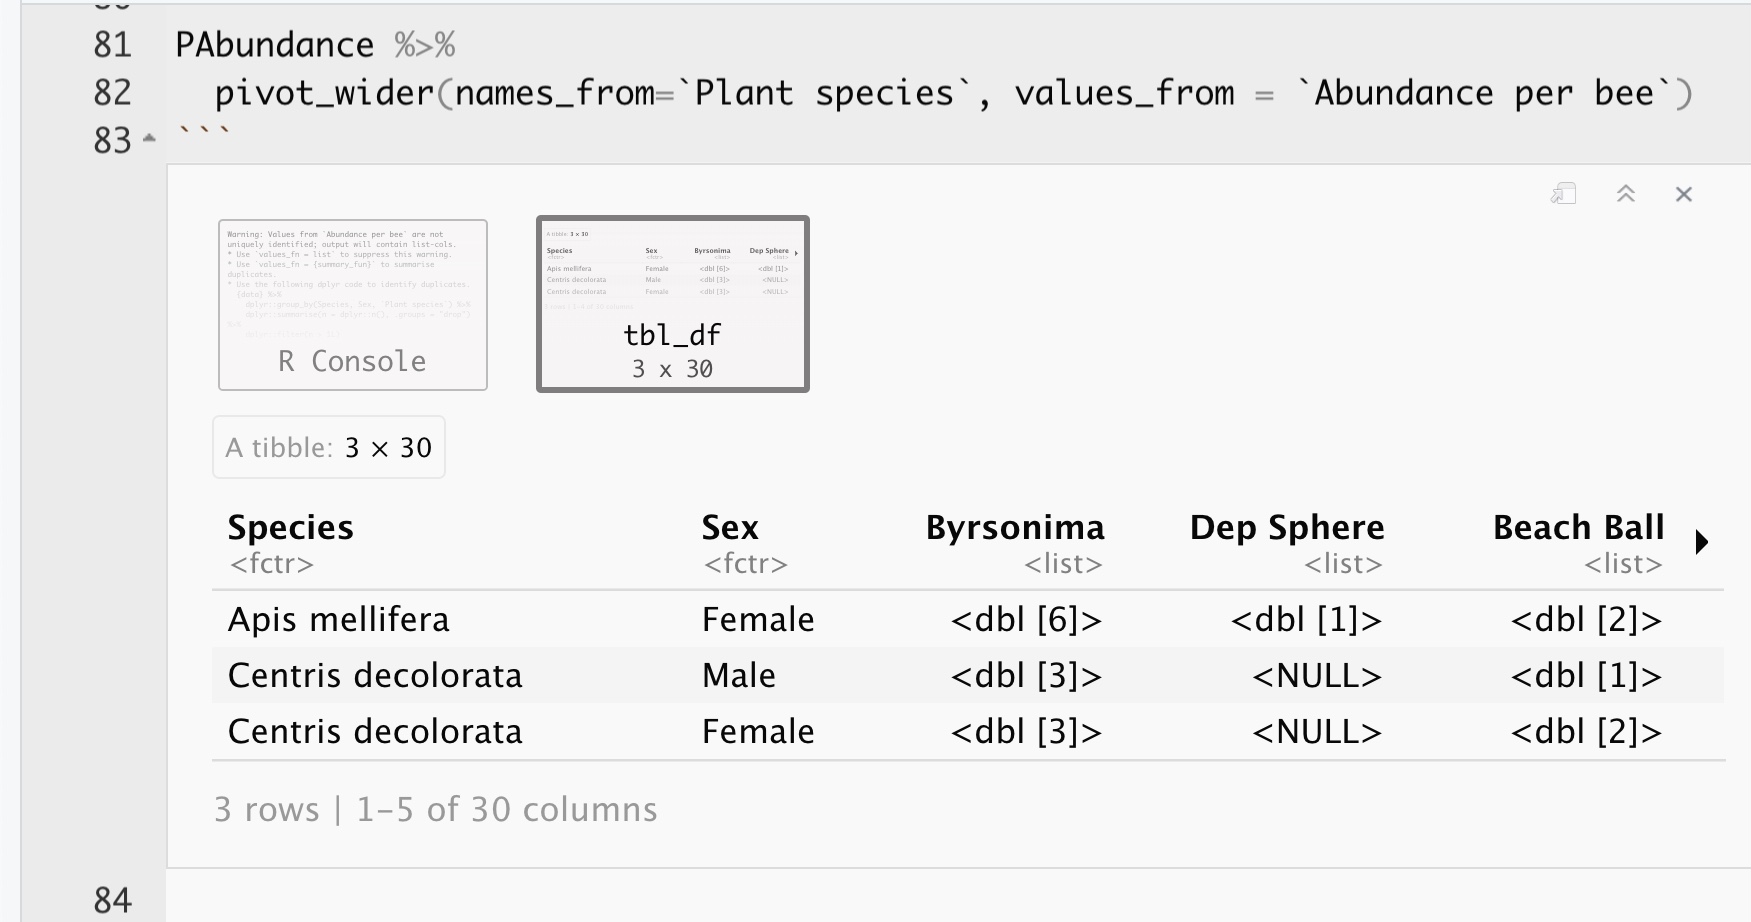
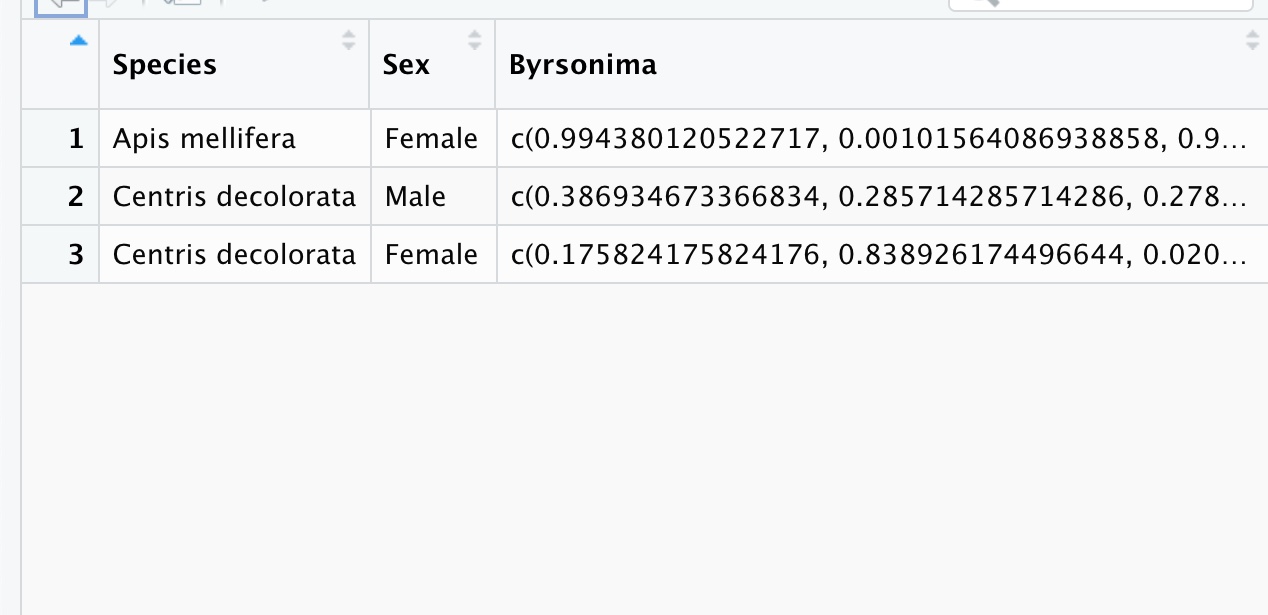
The observations are being grouped by each bee species and by Plant Species. I would like to ungroup the observations in order to see the multiple observations (rows) for each bee species. How can I obtain this using pivot_wider?

I tried using unlist() but it created multiple columns for each Plant Species; for example: Byrsonima1, Byrsonima2, etc.

Thank you!

Hi!

To help us help you, could you please prepare a reproducible example (reprex) illustrating your issue? Screenshots are not very useful, specially for sharing sample data. Please have a look at this guide, to see how to create one:

1 Like

Thank you. Hopefully this helps, here’s a mini data set to use as an example and the code I’ve been using with pivot_wider:

β€”β€”β€”β€”β€”β€”β€”β€”β€”β€”β€”β€”β€”β€”β€”β€”β€”β€”β€”β€”β€”β€”-

library(tidyverse)

Species<- c("Apis mellifera","Apis mellifera","Apis mellifera","Apis mellifera", "Centris decolorata","Centris decolorata","Centris decolorata","Centris decolorata","Centris decolorata","Centris decolorata")

Plant_Species<- c("Asteraceae", "Asteraceae", "Byrsonima", "Byrsonima","Byrsonima", "Byrsonima", "Passiflora", "Passiflora", "Lamiaceae", "Lamiaceae")

Abundance<- c(0.1, 0.5, 0.03, 0.06, 0.9, 0.7, 0.8, 0.5, 0.2, 0.3)

BAbundance<- data.frame(Species, Plant_Species, Abundance)

BAbundance %>%
pivot_wider(names_from=Plant_Species, values_from = Abundance)

β€”β€”β€”β€”β€”β€”β€”β€”β€”β€”β€”β€”β€”β€”β€”β€”β€”β€”β€”β€”β€”

This what I wish to obtain with pivot_wider:

Since values are repeated in the Species column, you can make each row unique by adding a column for row number. Once that's in place, use pivot_wider() to transform your data, drop the row column, and replace NAs with 0. The arrange lines below are not necessary but were included to ensure the result matched your desired output.

BAbundance %>%
  mutate(row = row_number()) %>%
  arrange(Species, Plant_Species) %>%
  pivot_wider(names_from=Plant_Species, values_from = Abundance) %>%
  arrange(row) %>%
  select(-row) %>%
  mutate_at(2:5, ~replace_na(., 0))
#> # A tibble: 10 Γ— 5
#>    Species            Asteraceae Byrsonima Lamiaceae Passiflora
#>    <chr>                   <dbl>     <dbl>     <dbl>      <dbl>
#>  1 Apis mellifera            0.1      0          0          0  
#>  2 Apis mellifera            0.5      0          0          0  
#>  3 Apis mellifera            0        0.03       0          0  
#>  4 Apis mellifera            0        0.06       0          0  
#>  5 Centris decolorata        0        0.9        0          0  
#>  6 Centris decolorata        0        0.7        0          0  
#>  7 Centris decolorata        0        0          0          0.8
#>  8 Centris decolorata        0        0          0          0.5
#>  9 Centris decolorata        0        0          0.2        0  
#> 10 Centris decolorata        0        0          0.3        0

Created on 2022-09-23 with reprex v2.0.2.9000

1 Like

Thank you!!! It workedπŸ™ŒπŸ½

1 Like

This topic was automatically closed 7 days after the last reply. New replies are no longer allowed.

If you have a query related to it or one of the replies, start a new topic and refer back with a link.