plotting bar graph of dataset using ggplot2 package

hello guys sai here, i'm trying to plot bar plot of a numeric vector dataset using ggplot2 package but i'm facing problem in plotting even i've converted the vector into a dataframe.
here's the code

z<-c(0.36,1.189,0.614,0.273,2.646,0.571,1.827,0.537,0.374,0.262,0.448,0.971,0.372,0.898,0.411,1.925,0.550,0.622,0.610,0.319,0.406,0.767,0.385,0.674,0.521,0.603,0.533,1.177,0.307,1.499)
length(z)
x=z
y=1:30
df=data.frame(x,y)
ggplot(data = df,mapping = aes(x,y))+geom_bar()

2023-03-07 (1)|487x112
so, advice me how can i redress this problem ?

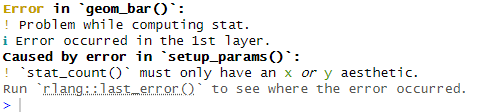
If you want to directly supply the numbers to plot and both x and y values, use geom_col(). The geom_bar() counts how many times each value appears, so it only takes x or y as an argument.

library(ggplot2)
z<-c(0.36,1.189,0.614,0.273,2.646,0.571,1.827,0.537,0.374,0.262,0.448,0.971,0.372,0.898,0.411,1.925,0.550,0.622,0.610,0.319,0.406,0.767,0.385,0.674,0.521,0.603,0.533,1.177,0.307,1.499)
length(z)
x=z
y=1:30
df=data.frame(x,y)

ggplot(data = df,mapping = aes(x,y))+geom_col()

1 Like

This topic was automatically closed 7 days after the last reply. New replies are no longer allowed.

If you have a query related to it or one of the replies, start a new topic and refer back with a link.