0
I have various .tif files named as:
20060103

20060113

20060124

20060203

20060213

20060221

..

..

...

20101224
Files correspond to three dates per each month. Files nomenclature is like yyyymmdd
I want to calculate and plot monthly mean where X axis should represent mean of Jan 2006, Feb 2006, Mar 2006, ......, Dec 2010 and Y axis represents data values
I am able to plot spatial time series for 5 months
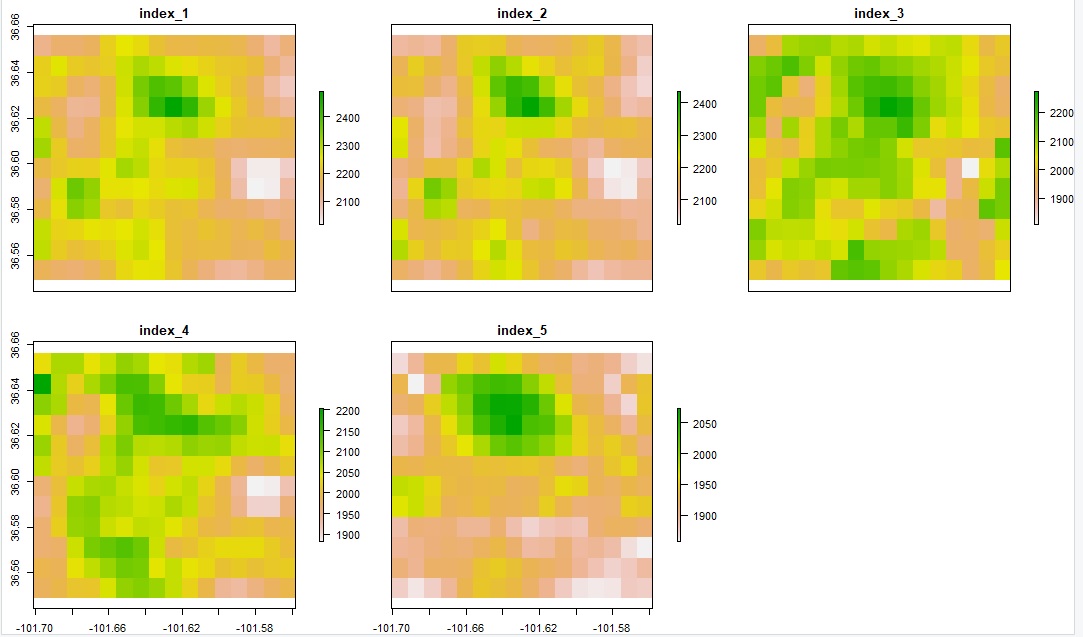
    ppt<-list.files('C:/Users/shc-user/Desktop/Akanksha/USCRN/Albedo_data/CGLS/Test', full.names = TRUE, pattern = '.*tif')

ppt_stack<-stack(ppt)

ppt_mon<-stackApply(ppt_stack, indices=c(1,1,1,2,2,2,3,3,3,4,4,4,5,5,5), fun=mean)

plot(ppt_mon)
The code seems feasible to obtain spatial average for few months. But as I have 20 years of data, I am not able to do it for various months. Also, I want a plot as final output where x-axis represents the months e.g. Jan 2006, Feb 2006...Dec 2010 and y-axis represents data values.
I am trying it in R