Hi, I am trying to plot a time series from an excel spreadsheet using the code:
plot(number_of_births~birth.data$date, type = "1",
main='Daily total female births in califorina, 1959',
ylab = 'Number of births', xlab='Date')
When I run the code, I get the error "Error in (function (formula, data = NULL, subset = NULL, na.action = na.fail, : invalid type (NULL) for variable ' number of births". Does anyone know what is going wrong? I have included all of my code below:
library(astsa)
set working directory for the folder we will be working with, sets what folder we pull the excel file from
setwd("C:/Users/muirb/OneDrive/Documents/Coursera Time Series Analysis")
read in the datafile
#read.csv("daily-total-female-births-in-cal.csv")
#read data to R variable
birth.data<-read.csv("daily-total-female-births-in-cal.csv")
I was able to read the data to the R variable and pull out the births column with no errors, however, when I run the line of code "birth.data$Date<-as.Date(birth.data$Date, "%m/%d/%Y")", I get an error stating that there is an "Error in $<-.data.frame(*tmp*, Date, value = numeric(0)) : replacement has 0 rows, data has 365". Does anyone know what is going on here? Thanks
From the screenshot of your csv file I can see that your variable is called date not Date (R is case sensitive), also, the dates are already in the ISO standard format Y-m-d (the only one R uses for dates) so you shouldn't try to parse it with a different format (i. e. "%m/%d/%Y").
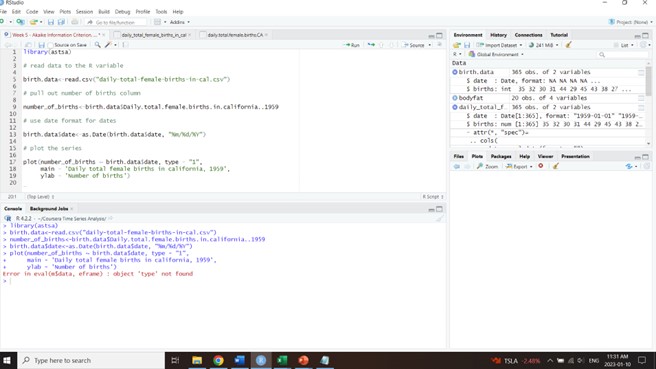
I was able to get past the line of code trying to parse out the the dates in a M/D/Y format, however, when I try to plot the series, I get the Error "Error in eval(M$data, eframe) : object 'type' not found. Does anyone know what is wrong here?
Yes, those first 6 rows are correct, and your plot looks like what I am trying to obtain. How did you obtain that plot? When I run the code:
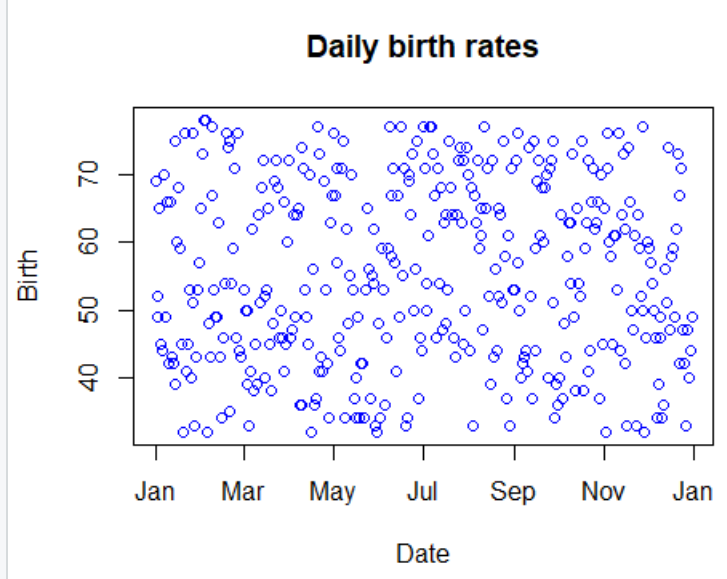
library(readxl)
df <- read_excel("C:\Users\muirb\OneDrive\Desktop\Coursera Time Series Analyses Course")
plot(df,main="Daily birth rates", col="blue")
I get errors stating that "'\U' used without hex digits in character string starting ""C:\U", and "Error in x(x) : argument "df1" is missing with no default. Does anyone know why this isn't working for me?
I have two files, both a csv and an Excel file, I can read either file into R, whatever would work. Here is the following code that I have:
library(astsa)

 # set working directory for the folder we will be working with, sets what folder we pull the csv file from
setwd("C:/Users/muirb/OneDrive/Documents/Coursera Time Series Analysis")

# read in the datafile
birth.data<-read.csv("daily-total-female-births-in-cal.csv")
#library(readxl)

#read data to R variable
birth.data<-read.csv("daily-total-female-births-in-cal.csv")

# pull out number of births column
number_of_births<-birth.data$Daily.total.female.births.in.california..1959

# use date format for dates
birth.data$Date<-as.Date(birth.data$Date, "%m/%d/%Y")

# plot the series
plot(number_of_births~birth.data$Date, type = "1",
     main='Daily total female births in califorina, 1959',
     ylab = 'Number of births', xlab='Date')
All of the lines of code up until the line: birth.data$Date<-as.Date(birth.data$Date, "%m/%d/%Y") run, after which I get the error "Error in $<-.data.frame(*tmp*, Date, value = numeric(0)) :
replacement has 0 rows, data has 365".
Likewise, when I try plotting the series using the code: plot(number_of_births~birth.data$Date, type = "1",
main='Daily total female births in califorina, 1959', ylab = 'Number of births', xlab='Date'), I get the error "Error in (function (formula, data = NULL, subset = NULL, na.action = na.fail, : invalid type (NULL) for variable 'number_of_births".
Do you know how to correct these errors. I am a new R user trying to figure things out. Thanks.
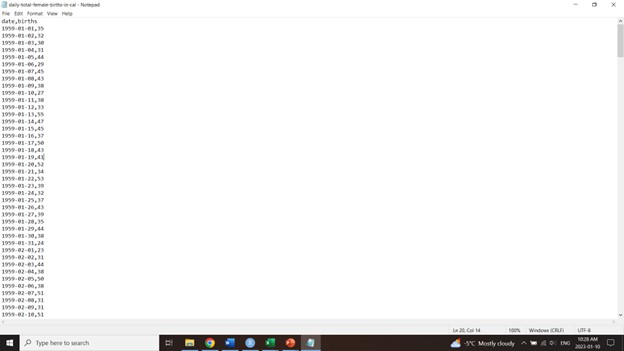
Yes, here is the raw content of my csv file. I have included the first 6 records, however, there are 365 records in the file. I just didn't want to post them all and create an unnecessarily long post.
Ok, I think I already explained these things to you but I'm going to give it another try.
Your csv file only has two columns, "date" and "births", there is no column called "Daily.total.female.births.in.california..1959". You can't extract a column that doesn't exist so this line fails.
The column in your data is called date not Date (R is case sensitive) and it is already in the proper format so you don't need to specify a parsing date format.
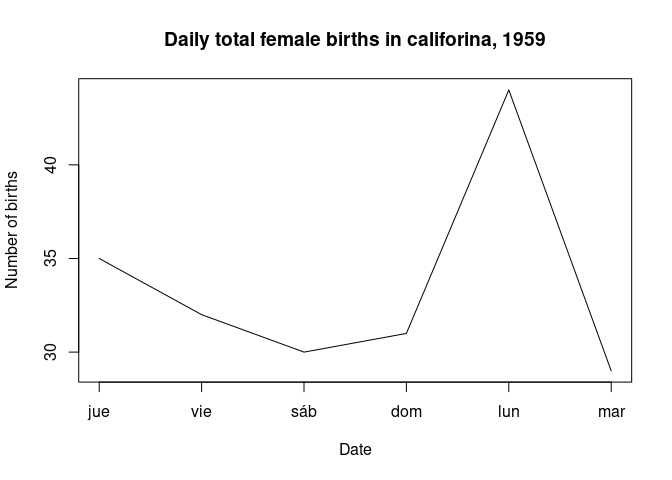
I think you actually mean type = "l" which stands for "line".
Having all this things into consideration, you can get the desired plot
birth.data <- read.csv("daily-total-female-births-in-cal.csv")

birth.data$date <- as.Date(birth.data$date)

plot(birth.data$births ~ birth.data$date, type = "l",
     main='Daily total female births in califorina, 1959',
     ylab = 'Number of births', xlab='Date')