Hello,
I tried seeking help a few weeks ago for this problem but no bites, so I'm redoing it in the hope that someone will be interested in solving this for me, as I don't think it's a very complicated problem, I just don't exactly how to do it.
I'm creating an app that takes a .csv file and spits out concentration values after doing some analysis on the back end. The analysis involves running a 5-parameter logistic curve using the drc() package and then storing the model coefficients to use in a function, which is where I'm running into trouble.
Here is some sample data that can be stored into a .csv file for use in the app:
smpdata <- structure(list(Sample = c("Std 0", "Std 0", "Std 1", "Std 1",
"Std 2", "Std 2", "Std 3", "Std 3", "Std 4", "Std 4"), Absorbance = c(0.854,
0.876, 0.736, 0.736, 0.551, 0.569, 0.46, 0.414, 0.312, 0.307),
    Concentration = c(0, 0, 0.05, 0.05, 0.15, 0.15, 0.4, 0.4,
    1.5, 1.5)), row.names = c(NA, 10L), class = "data.frame")
Now that we have the data, here is the code input and outputs that I am specifically having an issue with, with my comments.
library(ggplot2)
library(dplyr)
library(tidyverse)
library(drc)
library(shiny)
# function that I need to calculate concentration values
concentration <- function(y){
c*(((a-d)/(y-d))^(1/m)-1)^(1/b)
}
# User uploads the .csv file
ui <- fluidPage(
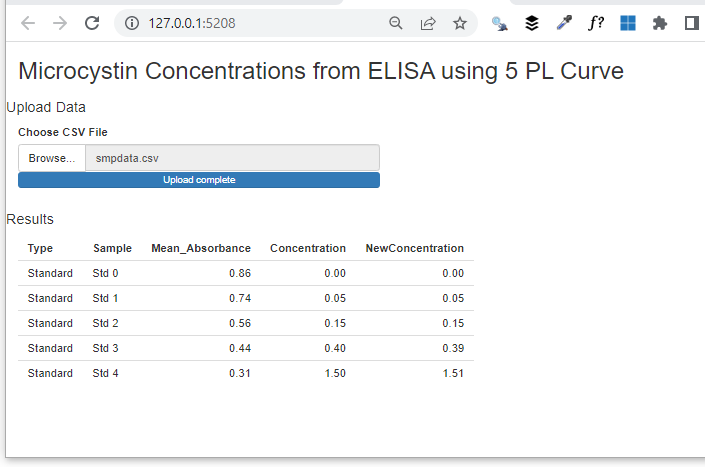
titlePanel("Microcystin Concentrations from ELISA using 5 PL Curve"),
fluidRow(
h4("Upload Data"),
column(6,
fileInput("file", "Choose CSV File",
multiple = F,
accept = c("text/csv",
"text/comma-separated-values,text/plain",
".csv"),
placeholder = "CSV files only",
width = "100%"))),
# Results from data are shown in a table in the server
fluidRow(
h4("Results"),
column(6,
verbatimTextOutput("results"))))
)
server <- function(input, output, session) {
data <- reactive({
req(input$file)
read.csv(input$file$datapath)
})
dt <- reactive({
data() %>%
filter(!Absorbance == 0) %>%
group_by(Sample) %>%
mutate(Mean_Absorbance = mean(Absorbance)) %>%
distinct(Sample, .keep_all = T) %>%
dplyr::select(Type, Sample, Mean_Absorbance, Concentration)})
stds <- reactive({dt() %>%
filter(Type == "Standard")})
fiveplc <- reactive({drm(Mean_Absorbance ~ Concentration, data=stds(),
fct = LL.5(names = c("b", "d", "a", "c", "e")))})
sum.fiveplc <- reactive({summary(fiveplc())})
# THIS IS WHERE THE APP STOPS WORKING
output$results <- renderTable({
b <- sum.fiveplc()$coefficients[1] # store model coefficients to variable
d <- sum.fiveplc()$coefficients[2]
a <- sum.fiveplc()$coefficients[3]
c <- sum.fiveplc()$coefficients[4]
m <- sum.fiveplc()$coefficients[5]
dt()$NewConcentration <- concentration(dt()$Mean_Absorbance)
dt()
})
}
shinyApp(ui, server)
I keep getting errors, in this example, the error is Error: object 'd' not found. I have tried all kinds of different formats. I also tried putting the function within the server as a reactive, but then I got the error Error: unused argument (dt()$Mean_Absorbance).
Can anyone sense what is going on wrong here?
Any help would be vastly appreciated. Thank you so much.