Hello everyone! I'm beginner in R.
Today, I wanted to make a plot of pubs in UK, but it always gives me mistake in aesthetics...
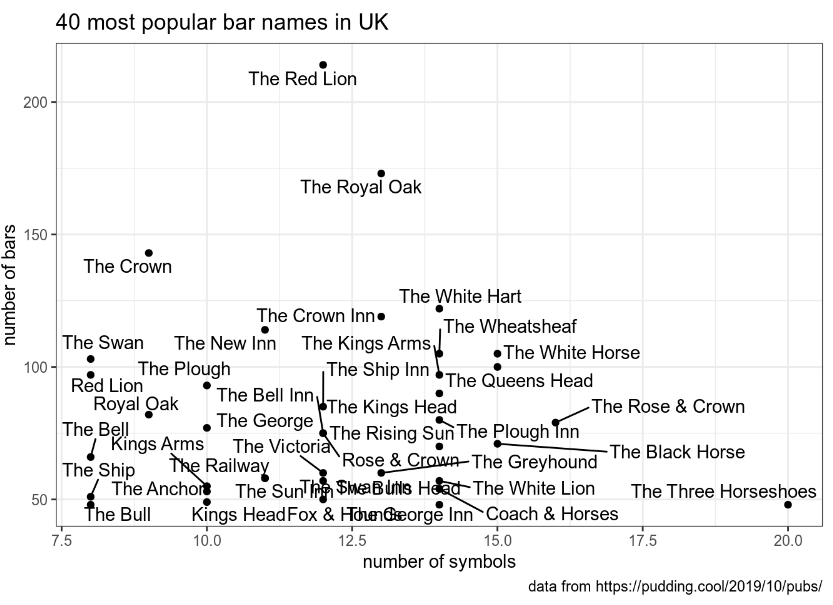
My goal is to make this:
where 40 or 50 most frequent names of pubs in the UK: the x-axis is for the number of symbols in the pub name, the y-axis is for the number of bars with the same name.
I made this as variables:
Warning message:
ggrepel: 13 unlabeled data points (too many overlaps). Consider increasing max.overlaps
But that doesn't prevent successful plotting (it's a warning, not an error). It's just telling me that there are too many names overlapping so it can't write all the names. I can force writing all the labels either by increasing plot size or by changing max.overlaps (but that makes the plot hard to read):