Problems with arrows

Hello,

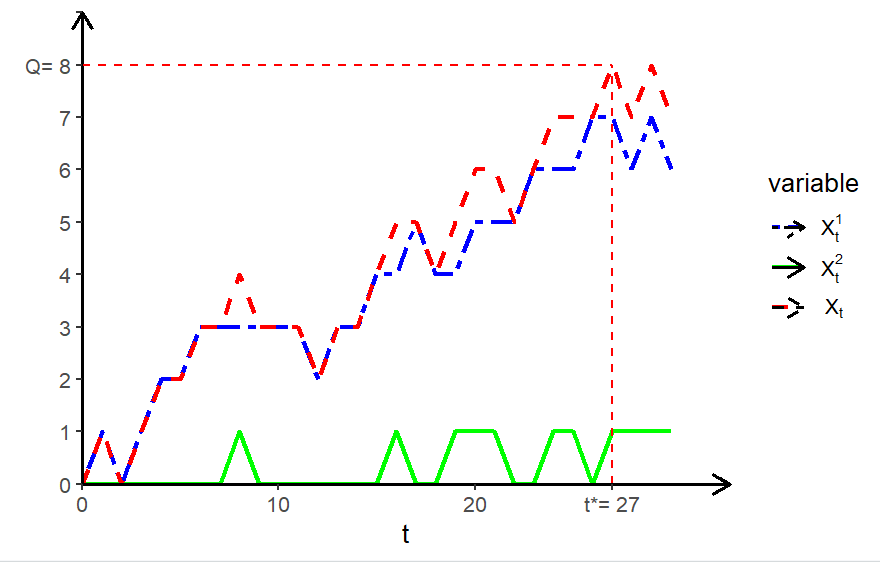
why do I have arrows on the legend ?

f4= ggplot(data_long,aes(x=t,y=value, color=variable, linetype=variable))+
geom_line(size=1)+
geom_segment(aes(x=0, xend = N*1.1 , y=0, yend = 0), size=0.7,arrow = arrow(length = unit(0.3,"cm")), color='black') +
geom_segment(aes(x=0, xend = 0 , y=0, yend =Q+1), size=0.7,arrow = arrow(length = unit(0.3,"cm")), color='black') +
coord_cartesian(clip = "off")+
scale_linetype_manual(values=c("twodash","solid","dashed"), labels=c(TeX("X_t^1"),TeX("X_t^2"),TeX("X_t")))+
scale_color_manual(values=palette, labels=c(TeX("X_t^1"),TeX("X_t^2"),TeX("X_t")))+
geom_segment(x = 0 , xend = tbar, y = Q, yend = Q, linetype = "dashed", color = "red") +
geom_segment(x = tbar , xend = tbar, y = 0, yend = Q, linetype = "dashed", color = "red") +

scale_x_continuous(breaks=c(set(0,N,10,tbar),tbar),labels=c(as.character(set(0,N,10,tbar)),paste("t*=",tbar)), expand = c(0, 0), limits = c(0, N*1.1)) +
scale_y_continuous(breaks=seq(0,Q+1), labels=c(as.character(seq(0,Q-1)),paste("Q=",Q),""), expand = c(0, 0), limits = c(0, Q+1))+
theme(axis.title=element_text(size=14))+
ylab("")+
xlab(TeX("t"))+
theme_classic()
f4

Thanks for your help !

My thought process is; legends are compiled from aes() applied on your geoms.
I see you have geom_segments with aes() and arrows set; So on that basis it makes sense to me to see arrows on your legend.

The problem remains without aes.

If you could provide a reprex that would help myself and others run your code.

Here is a code you should be able to run that reproduces the problem. The graph is different but it does not matter. The legends is the problem. To be a little more specific, I want the axis that way with geom_segment and the theme classic (please avoid element_line with arrow that does not please me). Curves depend on colour and linetype which the legend should display.

library(ggplot2)
library(reshape2)
N=100
Q=6
X_1t=rnorm(N,2,1)
X_2t=rnorm(N,2,1)
X_t=X_1t+X_2t
t=1:N
palette=c("blue","green", "red")
data=data.frame(t,X_1t,X_2t,X_t)
data_long <- melt(data, id = "t")
f4= ggplot(data_long,aes(x=t,y=value, color=variable, linetype=variable))+
geom_line(size=1)+
geom_segment(x=0, xend = N, y=0, yend = 0, size=0.7,arrow = arrow(length = unit(0.3,"cm")), color='black') +
geom_segment(x=0, xend = 0 , y=0, yend =Q+1, size=0.7,arrow = arrow(length = unit(0.3,"cm")), color='black') +
coord_cartesian(clip = "off")+
scale_linetype_manual(values=c("twodash","solid","dashed"), labels=c("X1","X2","X"))+
scale_color_manual(values=palette, labels=c("X1","X2","X"))+
scale_x_continuous(expand = c(0, 0), limits = c(0, N)) +
scale_y_continuous(expand = c(0, 0), limits = c(0, Q+1))+
theme(axis.title=element_text(size=14))+
ylab("")+
xlab("t")+
theme_classic()
f4

The arrows are there because you've added them to your plot as a geom with geom_segment(). Same code below with those segments commented out.

library(ggplot2)
library(reshape2)
N <- 100
Q <- 6
X_1t <- rnorm(N, 2, 1)
X_2t <- rnorm(N, 2, 1)
X_t <- X_1t + X_2t
t <- 1:N
palette <- c("blue", "green", "red")
data <- data.frame(t, X_1t, X_2t, X_t)
data_long <- melt(data, id = "t")
f4 <- ggplot(data_long, aes(x = t, y = value, color = variable, linetype = variable)) +
  geom_line(size = 1) +
  # geom_segment(x=0, xend = N, y=0, yend = 0, size=0.7,arrow = arrow(length = unit(0.3,"cm")), color='black') +
  # geom_segment(x=0, xend = 0 , y=0, yend =Q+1, size=0.7,arrow = arrow(length = unit(0.3,"cm")), color='black') +
  coord_cartesian(clip = "off") +
  scale_linetype_manual(values = c("twodash", "solid", "dashed"), labels = c("X1", "X2", "X")) +
  scale_color_manual(values = palette, labels = c("X1", "X2", "X")) +
  scale_x_continuous(expand = c(0, 0), limits = c(0, N)) +
  scale_y_continuous(expand = c(0, 0), limits = c(0, Q + 1)) +
  theme(axis.title = element_text(size = 14)) +
  ylab("") +
  xlab("t") +
  theme_classic()
#> Warning: Using `size` aesthetic for lines was deprecated in ggplot2 3.4.0.
#> ℹ Please use `linewidth` instead.
#> This warning is displayed once every 8 hours.
#> Call `lifecycle::last_lifecycle_warnings()` to see where this warning was
#> generated.
f4

Created on 2023-03-31 with reprex v2.0.2

One can add those arrow geom_segments, and supress them from showing in the legend

   geom_segment(x=0, xend = N, 
                y=0, yend = 0, 
                size=0.7,
                arrow = arrow(length = unit(0.3,"cm")),
                color='black',
                show.legend = FALSE) +
   geom_segment(x=0, xend = 0 , 
                y=0, yend =Q+1,
                size=0.7,
                arrow = arrow(length = unit(0.3,"cm")),
                color='black',
                show.legend = FALSE) +
1 Like

Ok, thanks, I missed the "show.legend=FALSE" option. That solves my problem.

Thank you again @nirgrahamuk. I am working on a PhD article that needs qualitative illustration so I may have again quite basic questions regarding ggplot in the coming weeks. That is also why I am often reluctant to give my personnal code and have to struggle to try to find one that replicate the exact same problem. See you soon, I hope.

This topic was automatically closed 7 days after the last reply. New replies are no longer allowed.

If you have a query related to it or one of the replies, start a new topic and refer back with a link.