Hello!
I am trying to add formulas into PowerPoint slides from Shiny. However, the formulas do not "expand", but rather go to the next line.
Here is my code:
library(shiny)
library(officer)
library(flextable)
library(dplyr)
my_table <- data.frame(
Name = letters[1:4],
Age = seq(20, 26, 2),
Occupation = LETTERS[15:18],
Income = c(50000, 20000, 30000, 45000)
)
ui <- fluidRow(
column(
width = 12,
align = "center",
tableOutput("data"),
br(),
downloadButton("download_powerpoint", "Download Data to PowerPoint")
)
)
server <- function(input, output) {
library(flextable)
library(officer)
library(dplyr)
library(latex2exp)
output$data <- renderTable({
my_table
})
output$download_powerpoint <- downloadHandler(
filename = function() {
"employee_data.pptx"
},
content = function(file) {
flextable_prep <- flextable(my_table) %>%
colformat_num(col_keys = c("Age", "Income"), digits = 0) %>%
width(width = 1.25) %>%
height_all(height = 0.35) %>%
theme_zebra() %>%
align(align = "center", part = "all")
example_pp <- read_pptx()
example_pp <-add_slide(example_pp,layout = "Title Slide",
master = "Office Theme")
print("first slide")
example_pp <- ph_with(x=example_pp,
location=ph_location_type(type="ctrTitle"),
value = "Employee Data"
)
print("first ph_with")
example_pp <- ph_with(x=example_pp,
location = ph_location_type(type = "subTitle"),
value = "Company 2019 Report"
)
print("second ph_with")
xmj <-c(
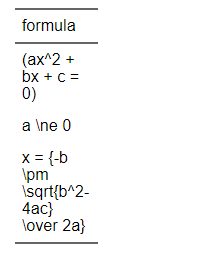
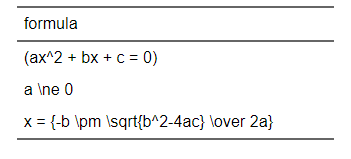
"(ax^2 + bx + c = 0)",
"a \\ne 0", "x = {-b \\pm \\sqrt{b^2-4ac} \\over 2a}")
df1 <- data.frame(formula=xmj)
ft1 <- flextable(df1)
ft1 <- compose(
x = ft1,j="formula",
value=as_paragraph(as_equation(formula)))
ft1 <- align(ft1,align="center",part="all")
# ft1 <- width(ft1,width=5)
example_pp <- add_slide(example_pp,layout = "Title and Content",
master = "Office Theme")
example_pp <- ph_with(x=example_pp,
location=ph_location_type(type="body"),
value = "Test"
)
print("third ph_with")
table_width <- sum(dim(ft1)$widths)
table_height <- sum(dim(ft1)$heights)
print(table_width)
print(table_height)
slide_width <- 10
slide_height <- 7.5
table_leftmargin <- (slide_width-table_width)/2
table_topmargin <- (slide_height-table_height)/2
print("left")
print(table_leftmargin)
example_pp <- ph_with(x=example_pp,
value = ft1,
# location=ph_location(left=table_leftmargin,
# top=table_topmargin)
location=ph_location_type(type="body")
)
example_pp <- set_notes(x=example_pp,
value="Correct Answer",
location=notes_location_type("body")
)
print(example_pp, target = file)
}
)
}
shinyApp(ui, server)
And here is the "bad" slide:
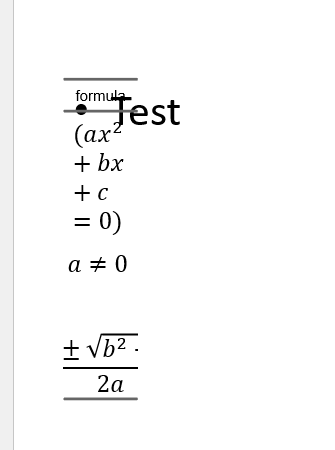
Any suggestions, please?
Thank you so much!
Erin