Dear all,
I have a code for creating a map that works. I am now trying to add a raster layer with salinity gradient. I have been following a couple of tutorials and my current approach goes as follows:
# Loads .TIF file ~
Salinity <- stack("Present.Surface.Salinity.Mean.tif")

# Converts .TIF into dataframe ~
Salinity_df <-
  as.data.frame(Salinity, xy = TRUE) %>%
  # Removes cells with NA for any of the layers ~
  na.omit() %>%
  # Subsamples data that will be plotted ~
  filter(x >= -11 & x <= 31 & y >= 49.75 & y <= 67)

# Prepares Salinity_df ~
Salinity_df$Present.Surface.Salinity.Mean <- as.character(Salinity_df$Present.Surface.Salinity.Mean)

# Plots map ~
ggplot(data = Salinity_df) +
  geom_raster(aes(x = x, y = y, fill = `Present.Surface.Salinity.Mean`)) +
  scale_fill_viridis_d() +
  theme_void() +
  theme(legend.position = "bottom")
Everything runs well but this final step where I try to plot the data. I do not get an error — it just runs for ever and ever (I have left it running overnight).
However, if I do something as simple as:
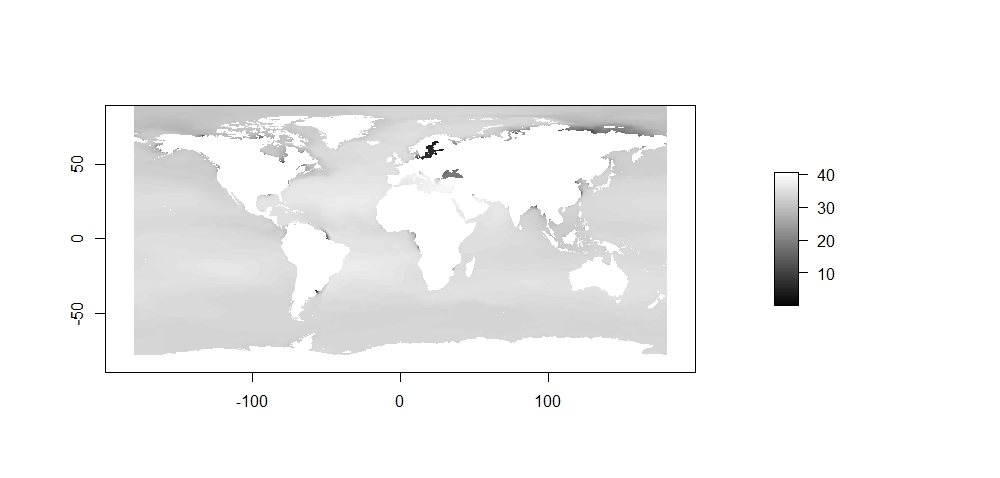
par(mar = rep(2, 4))
plot(Salinity, col = gray(1:100 / 100))
It does run and I get a map:
Thus, I would like to understand this behaviour of geom_raster — I have seen some people saying that it is indeed slow but is it really that slow? Is it simply plotting the data or is it performing some sort of additional computation that is not performed by plot?
The .TIF file can be downloaded from here.
Many thanks in advance, George.