R4DS2e 12.4.6 Exercises Problem 3 issue

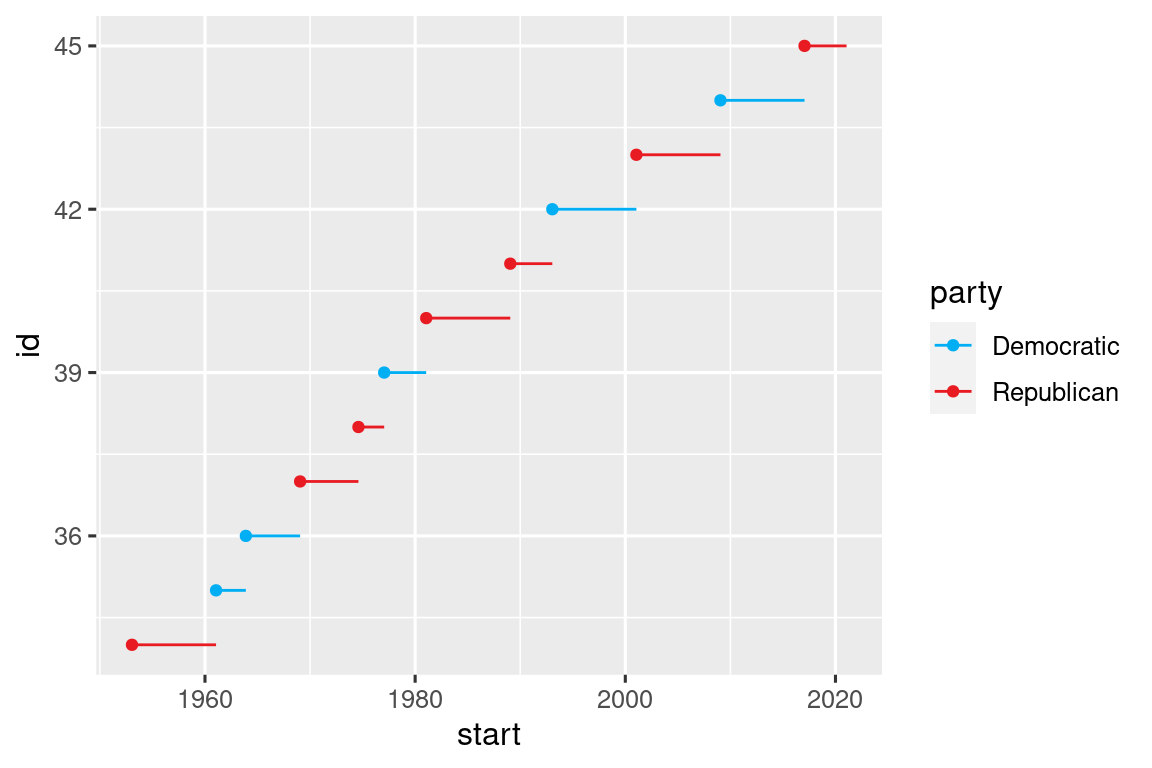
Working through the "Communication" section of the R4DS second edition, and in the subsection on scales. I'm working through one of the exercises that asks me to use the "presidential" dataset that comes with ggplot2 and better communicate the display of presidential terms. Specifically, in this case, I need to improve the display of the Y axis so that the name of the president shows up on the y-axis next to their corresponding point and segment.

(The picture I've uploaded is from this chapter of the book and is the base off of which the exercise question asks me to build. As you see in the picture, the y-axis is "id", which is just the row number of the observation + 33 -- I.E. Obama is row number 11 + 33 = 44th president . But the axis only displays major breaks and labels at 36, 39, 42, 45. I need breaks (presidential$id) and labels (presidential$name) for every president displayed in the plot

Here is my code below. For whatever reason I get a warning "Warning message:
Unknown or uninitialised column: id." whenever I execute this code and a plot that returns no y-axis breaks or labels.

presidential |>
        mutate(id = 33 + row_number()) |> 
        ggplot(aes(start, id, color = party)) +
          geom_point() +
          geom_segment(aes(xend = end, yend = id)) +
          scale_colour_manual(values = c(Republican = "red", Democratic = "blue")) +
          scale_x_date(breaks = presidential$start, 
                       date_labels = "'%y") +
          scale_y_continuous(breaks = presidential$id, 
                             labels = presidential$name, 
                             minor_breaks = NULL) 

However, when I just make the breaks argument in scale_y_continuous a numerical range (breaks = 33:45), the plot runs as it should?

presidential |>
        mutate(id = 33 + row_number()) |> 
        ggplot(aes(start, id, color = party)) +
          geom_point() +
          geom_segment(aes(xend = end, yend = id)) +
          scale_colour_manual(values = c(Republican = "red", Democratic = "blue")) +
          scale_x_date(breaks = presidential$start, 
                       date_labels = "'%y") +
          scale_y_continuous(breaks = 34:45, 
                             labels = presidential$name, 
                             minor_breaks = NULL) 

Is there a reason that R won't accept presidential$id but will accept the exact same values when written as a sequence of numbers? Thanks for any help or explanation you can provide

What is the content of presidential$id? You might need to re-read your code a few times (the answer is just in front of your eyes :slight_smile: )

spoiler rot13: Gurer vf ab pbyhza vq va gur cerfvqragvny qngnfrg, gung pbyhza vf perngrq va gur zhgngr pnyy ng gur fgneg.

I appreciate the help ! Though just to follow up, why can't it take presidential$id if it's within the same chain of piping as the mutate and the ggplot that references "id" in its aesthetic mapping ? I just created a new data frame that has the mutated id column within it and then the chart worked as intended, but I'm curious if there's a way to write that code without having to create some sort of "presidential2" data frame? Thanks again!

For the same reason you need to use the full reference presidential$id.

In base R, you (almost) always need to fully specify where to find a variable. If id is a column of presidential, you basically always call it as presidential$id.

This is also how the function scale_y_continuous() works: if you look at ?scale_y_continuous, you'll find that the argument labels needs to be "A character vector giving labels (must be same length as breaks)" (among several options). So, for scale_y_continuous(), you can't just say labels = id or labels = name, you need to provide the actual character vector, telling R fully how to find it: presidential$id or presidential$name. The problem here, is that the data frame presidential does not contain a column id, and never did. id is defined by mutate() within a pipe, so your code is equivalent to:

presidential2 <- mutate(presidential, id = 33 + row_number())

ggplot(data = presidential2, mapping = aes(x = start, y = id)) +
  geom_point() +
  scale_y_continuous(labels = presidential$id)

In that case, it should be clear that presidential$id will fail, as it does not exist, but it would work with presidential2$id (which is identical to the result of the pipe in your initial code).

So in a way, the question is: why, in the call to aes(), don't you need to specify where to find start and party? This is because ggplot and the other tidyverse functions (like mutate()) are special: they start by taking a data frame, and then they assume the variables you mention are columns of this data frame.

If you look at ?aes, you'll notice this description:

x, y, ... <data-masking> List of ...

What this <data-masking> means is just that: aes() will look for its arguments in the data frame that has been supplied. Since scale_y_continuous() does not have a <data-masking> type of input, it can only take explicit vectors.

I don't think it is easily, that's a frustration I encounter from time to time and I haven't found a satisfying solution. There is a solution that's not-too-easy: create a function that contains all the ggplot code. Technically, you can even write an anonymous function that is called inside the pipe, but I don't think that's more elegant here.

Thank you for explaining this and being very generous with your time to do so, I appreciate it!

1 Like

This topic was automatically closed 21 days after the last reply. New replies are no longer allowed.

If you have a query related to it or one of the replies, start a new topic and refer back with a link.