jrkrideau:
dput(head(mydata, 100))
Thank you for you response, and the tip!
How is this:
> dput(head(VBP_Data2, 100))
structure(list(Date = structure(c(19083, 19083, 19083, 19083,
19083, 19083, 19083, 19083, 19083, 19083, 19083, 19083, 19083,
19083, 19083, 19083, 19083, 19083, 19083, 19083, 19083, 19083,
19083, 19083, 19083, 19083, 19083, 19113, 19113, 19113, 19113,
19113, 19113, 19113, 19113, 19113, 19113, 19113, 19113, 19113,
19113, 19113, 19113, 19113, 19113, 19113, 19113, 19113, 19113,
19113, 19113, 19113, 19113, 19113, 19144, 19144, 19144, 19144,
19144, 19144, 19144, 19144, 19144, 19144, 19144, 19144, 19144,
19144, 19144, 19144, 19144, 19144, 19144, 19144, 19144, 19144,
19144, 19144, 19144, 19144, 19144, 19174, 19174, 19174, 19174,
19174, 19174, 19174, 19174, 19174, 19174, 19174, 19174, 19174,
19174, 19174, 19174, 19174, 19174, 19174), class = "Date"), Provider = c("Encompass",
"Little Colorado Behavioral Health", "Spectrum", "The Guidance Center",
"Community Bridges", "Polara", "Changepoint", "Mohave Mental Health",
"Southwest Behavioral and Health", "Encompass", "Little Colorado Behavioral Health",
"The Guidance Center", "Community Bridges", "Polara", "Spectrum",
"Changepoint", "Mohave Mental Health", "Southwest Behavioral and Health",
"Encompass", "Community Bridges", "The Guidance Center", "Spectrum",
"Little Colorado Behavioral Health", "Polara", "Changepoint",
"Southwest Behavioral and Health", "Mohave Mental Health", "Encompass",
"Little Colorado Behavioral Health", "Spectrum", "The Guidance Center",
"Community Bridges", "Polara", "Changepoint", "Mohave Mental Health",
"Southwest Behavioral and Health", "Encompass", "Little Colorado Behavioral Health",
"Community Bridges", "The Guidance Center", "Polara", "Spectrum",
"Changepoint", "Mohave Mental Health", "Southwest Behavioral and Health",
"Encompass", "The Guidance Center", "Community Bridges", "Spectrum",
"Little Colorado Behavioral Health", "Polara", "Changepoint",
"Southwest Behavioral and Health", "Mohave Mental Health", "Encompass",
"Little Colorado Behavioral Health", "Spectrum", "The Guidance Center",
"Community Bridges", "Polara", "Changepoint", "Mohave Mental Health",
"Southwest Behavioral and Health", "Encompass", "Little Colorado Behavioral Health",
"Community Bridges", "The Guidance Center", "Spectrum", "Polara",
"Changepoint", "Mohave Mental Health", "Southwest Behavioral and Health",
"Encompass", "The Guidance Center", "Spectrum", "Little Colorado Behavioral Health",
"Polara", "Changepoint", "Southwest Behavioral and Health", "Mohave Mental Health",
"Community Bridges", "Encompass", "Little Colorado Behavioral Health",
"Spectrum", "The Guidance Center", "Community Bridges", "Polara",
"Changepoint", "Mohave Mental Health", "Southwest Behavioral and Health",
"Encompass", "Little Colorado Behavioral Health", "Community Bridges",
"The Guidance Center", "Spectrum", "Polara", "Changepoint", "Mohave Mental Health",
"Southwest Behavioral and Health", "Encompass"), SubMeasureID = c("AMM2",
"AMM2", "AMM2", "AMM2", "AMM2", "AMM2", "AMM2", "AMM2", "AMM2",
"FUH7", "FUH7", "FUH7", "FUH7", "FUH7", "FUH7", "FUH7", "FUH7",
"FUH7", "HDO", "HDO", "HDO", "HDO", "HDO", "HDO", "HDO", "HDO",
"HDO", "AMM2", "AMM2", "AMM2", "AMM2", "AMM2", "AMM2", "AMM2",
"AMM2", "AMM2", "FUH7", "FUH7", "FUH7", "FUH7", "FUH7", "FUH7",
"FUH7", "FUH7", "FUH7", "HDO", "HDO", "HDO", "HDO", "HDO", "HDO",
"HDO", "HDO", "HDO", "AMM2", "AMM2", "AMM2", "AMM2", "AMM2",
"AMM2", "AMM2", "AMM2", "AMM2", "FUH7", "FUH7", "FUH7", "FUH7",
"FUH7", "FUH7", "FUH7", "FUH7", "FUH7", "HDO", "HDO", "HDO",
"HDO", "HDO", "HDO", "HDO", "HDO", "HDO", "AMM2", "AMM2", "AMM2",
"AMM2", "AMM2", "AMM2", "AMM2", "AMM2", "AMM2", "FUH7", "FUH7",
"FUH7", "FUH7", "FUH7", "FUH7", "FUH7", "FUH7", "FUH7", "HDO"
), Compliant = c(36, 43, 68, 77, 85, 96, 139, 238, 290, 2, 1,
2, 1, 1, 3, 2, 12, 15, 2, 1, 2, 6, 6, 6, 38, 28, 17, 39, 55,
86, 94, 105, 119, 196, 286, 355, 7, 5, 6, 13, 20, 24, 21, 67,
49, 4, 5, 13, 12, 20, 13, 70, 55, 39, 41, 57, 89, 95, 104, 127,
206, 288, 367, 9, 6, 9, 19, 34, 26, 26, 81, 62, 4, 6, 12, 20,
12, 63, 55, 38, 10, 43, 60, 93, 98, 107, 136, 215, 296, 381,
8, 11, 11, 26, 38, 43, 47, 87, 94, 4), NonCompliant = c(25, 33,
54, 58, 63, 67, 99, 169, 216, 1, 3, 4, 9, 11, 10, 25, 15, 26,
22, 33, 33, 29, 53, 62, 117, 193, 223, 35, 40, 72, 75, 74, 88,
122, 188, 247, 3, 7, 22, 34, 28, 24, 42, 45, 71, 82, 105, 103,
120, 148, 217, 415, 686, 868, 34, 42, 74, 80, 76, 99, 124, 197,
261, 5, 12, 30, 38, 27, 38, 56, 70, 101, 81, 110, 120, 145, 216,
405, 702, 868, 105, 30, 38, 68, 72, 73, 89, 115, 188, 252, 11,
16, 35, 43, 40, 55, 80, 97, 131, 87), TotalEligible = c(61, 76,
122, 135, 148, 163, 238, 407, 506, 3, 4, 6, 10, 12, 13, 27, 27,
41, 24, 34, 35, 35, 59, 68, 155, 221, 240, 74, 95, 158, 169,
179, 207, 318, 474, 602, 10, 12, 28, 47, 48, 48, 63, 112, 120,
86, 110, 116, 132, 168, 230, 485, 741, 907, 75, 99, 163, 175,
180, 226, 330, 485, 628, 14, 18, 39, 57, 61, 64, 82, 151, 163,
85, 116, 132, 165, 228, 468, 757, 906, 115, 73, 98, 161, 170,
180, 225, 330, 484, 633, 19, 27, 46, 69, 78, 98, 127, 184, 225,
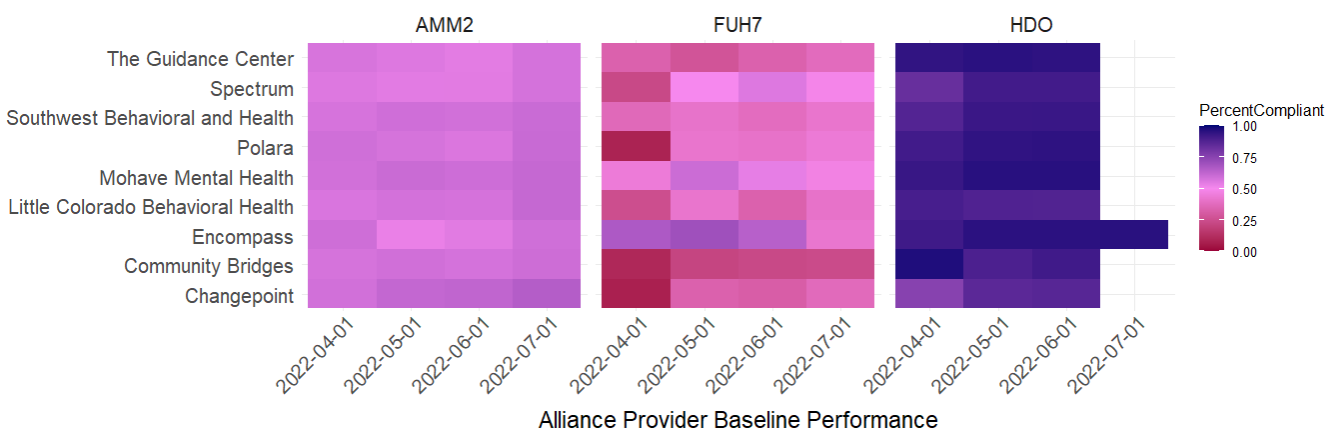
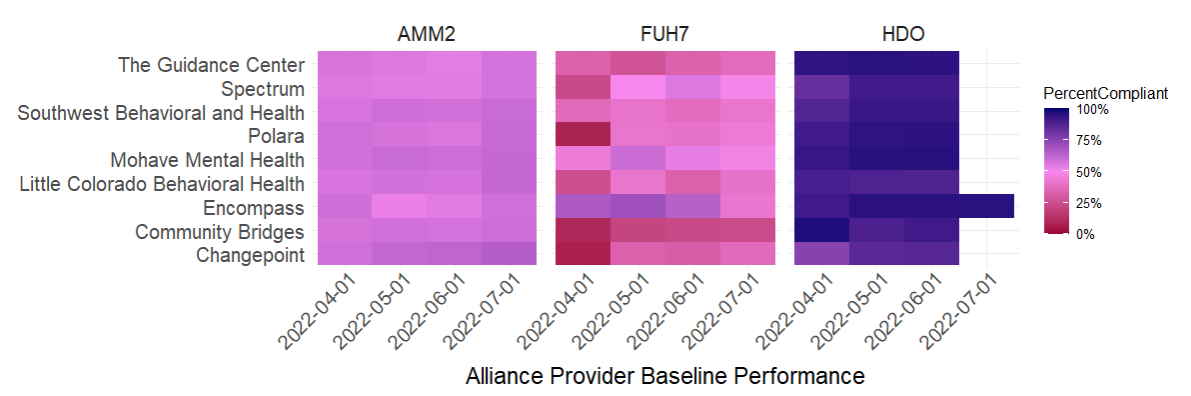
91), PercentCompliant = c(0.590163934426229, 0.565789473684211,
0.557377049180328, 0.57037037037037, 0.574324324324324, 0.588957055214724,
0.584033613445378, 0.584766584766585, 0.573122529644269, 0.666666666666667,
0.25, 0.333333333333333, 0.1, 0.0833333333333333, 0.230769230769231,
0.0740740740740741, 0.444444444444444, 0.365853658536585, 0.916666666666667,
0.970588235294118, 0.942857142857143, 0.828571428571429, 0.898305084745763,
0.911764705882353, 0.754838709677419, 0.873303167420814, 0.929166666666667,
0.527027027027027, 0.578947368421053, 0.544303797468354, 0.556213017751479,
0.58659217877095, 0.57487922705314, 0.616352201257862, 0.60337552742616,
0.589700996677741, 0.7, 0.416666666666667, 0.214285714285714,
0.276595744680851, 0.416666666666667, 0.5, 0.333333333333333,
0.598214285714286, 0.408333333333333, 0.953488372093023, 0.954545454545455,
0.887931034482759, 0.909090909090909, 0.880952380952381, 0.943478260869565,
0.855670103092784, 0.925775978407557, 0.957001102535832, 0.546666666666667,
0.575757575757576, 0.54601226993865, 0.542857142857143, 0.577777777777778,
0.561946902654867, 0.624242424242424, 0.593814432989691, 0.584394904458599,
0.642857142857143, 0.333333333333333, 0.230769230769231, 0.333333333333333,
0.557377049180328, 0.40625, 0.317073170731707, 0.536423841059603,
0.380368098159509, 0.952941176470588, 0.948275862068966, 0.909090909090909,
0.878787878787879, 0.947368421052632, 0.865384615384615, 0.927344782034346,
0.958057395143488, 0.91304347826087, 0.589041095890411, 0.612244897959184,
0.577639751552795, 0.576470588235294, 0.594444444444444, 0.604444444444444,
0.651515151515151, 0.611570247933884, 0.601895734597156, 0.421052631578947,
0.407407407407407, 0.239130434782609, 0.376811594202899, 0.487179487179487,
0.438775510204082, 0.37007874015748, 0.472826086956522, 0.417777777777778,
0.956043956043956)), row.names = c(NA, -100L), class = c("tbl_df",
"tbl", "data.frame"))