dear all, do you know kindly how I can limit the numbers on the column "responses" to -5 to 20 (now it is -20 to 40 and I don't know why) . thank you VERY much! Best Meta
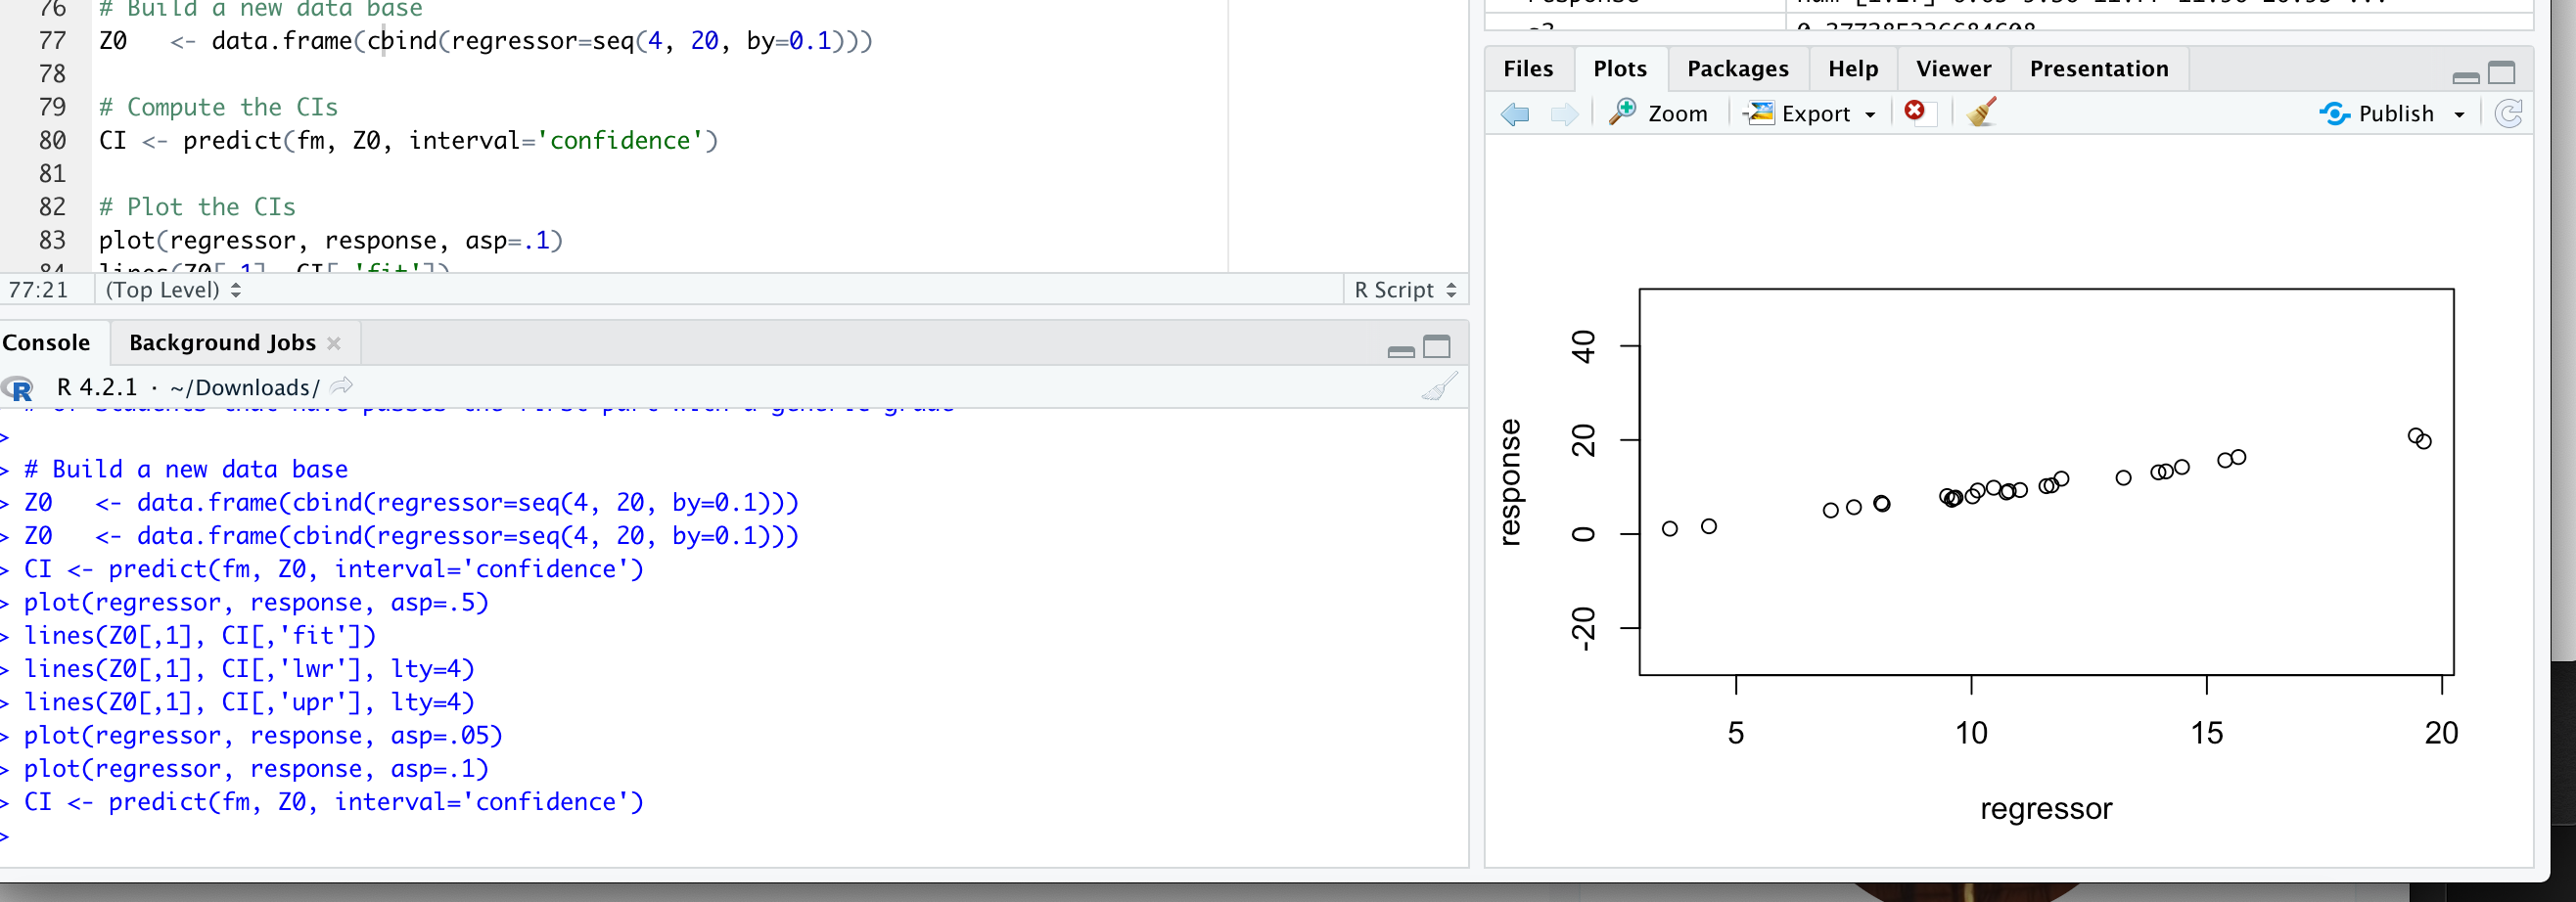
You can specify ylim = c(-5, 20) as an argument within the plot() function. Adjust the asp value to get the desired view.
1 Like
This topic was automatically closed 21 days after the last reply. New replies are no longer allowed.
If you have a query related to it or one of the replies, start a new topic and refer back with a link.