Dear R experts,
I have read the below excel file into R as a dataframe:
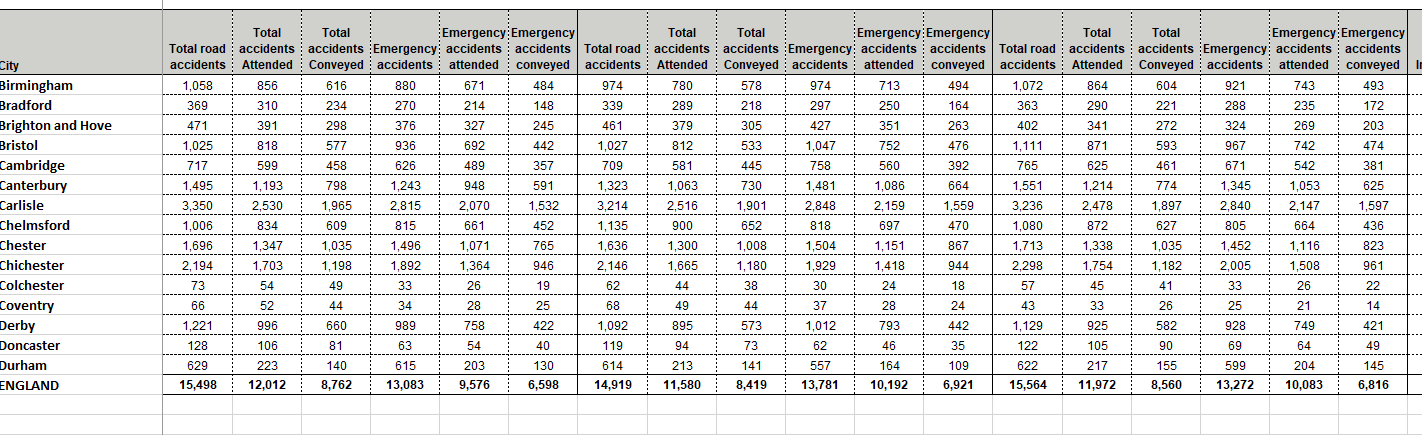
It currently contains many columns of data (but these columns are just a repetition of the same 6 columns: total road accidents, total road accidents attended, total accidents conveyed, emergency accidents, emergency accidents attended, emergency accidents conveyed).
I want to re-structure this dataframe to have only 7 columns (1 column for the city, and another 6 which groups all the data together under the relevant columns i.e.,1 column for all the 'total road accidents', 1 column for all the 'total accidents attended' and so on.
When collapsing these columns its important that the order of the data remains the same (i.e., the second column of 'total road accidents' should be placed directly under the first column of this heading, and the third underneath the second (and so on).
I have searched online but cannot find a solution to this. I have pasted a repex of the data frame below (the actual df has a lot more columns than this).
accidents <- structure(list(City = c("Birmingham", "Bradford", "Brighton and Hove",
"Bristol", "Cambridge", "Canterbury", "Carlisle", "Chelmsford",
"Chester", "Chichester", "Colchester", "Coventry", "Derby", "Doncaster",
"Durham", "ENGLAND"), `Total road accidents...2` = c(1058, 369,
471, 1025, 717, 1495, 3350, 1006, 1696, 2194, 73, 66, 1221, 128,
629, 15498), `Total accidents Attended...3` = c(856, 310, 391,
818, 599, 1193, 2530, 834, 1347, 1703, 54, 52, 996, 106, 223,
12012), `Total accidents Conveyed...4` = c(616, 234, 298, 577,
458, 798, 1965, 609, 1035, 1198, 49, 44, 660, 81, 140, 8762),
`Emergency accidents...5` = c(880, 270, 376, 936, 626, 1243,
2815, 815, 1496, 1892, 33, 34, 989, 63, 615, 13083), `Emergency accidents attended...6` = c(671,
214, 327, 692, 489, 948, 2070, 661, 1071, 1364, 26, 28, 758,
54, 203, 9576), `Emergency accidents conveyed...7` = c(484,
148, 245, 442, 357, 591, 1532, 452, 765, 946, 19, 25, 422,
40, 130, 6598), `Total road accidents...8` = c(974, 339,
461, 1027, 709, 1323, 3214, 1135, 1636, 2146, 62, 68, 1092,
119, 614, 14919), `Total accidents Attended...9` = c(780,
289, 379, 812, 581, 1063, 2516, 900, 1300, 1665, 44, 49,
895, 94, 213, 11580), `Total accidents Conveyed...10` = c(578,
218, 305, 533, 445, 730, 1901, 652, 1008, 1180, 38, 44, 573,
73, 141, 8419), `Emergency accidents...11` = c(974, 297,
427, 1047, 758, 1481, 2848, 818, 1504, 1929, 30, 37, 1012,
62, 557, 13781), `Emergency accidents attended...12` = c(713,
250, 351, 752, 560, 1086, 2159, 697, 1151, 1418, 24, 28,
793, 46, 164, 10192), `Emergency accidents conveyed...13` = c(494,
164, 263, 476, 392, 664, 1559, 470, 867, 944, 18, 24, 442,
35, 109, 6921), `Total road accidents...14` = c(1072, 363,
402, 1111, 765, 1551, 3236, 1080, 1713, 2298, 57, 43, 1129,
122, 622, 15564), `Total accidents Attended...15` = c(864,
290, 341, 871, 625, 1214, 2478, 872, 1338, 1754, 45, 33,
925, 105, 217, 11972), `Total accidents Conveyed...16` = c(604,
221, 272, 593, 461, 774, 1897, 627, 1035, 1182, 41, 26, 582,
90, 155, 8560), `Emergency accidents...17` = c(921, 288,
324, 967, 671, 1345, 2840, 805, 1452, 2005, 33, 25, 928,
69, 599, 13272), `Emergency accidents attended...18` = c(743,
235, 269, 742, 542, 1053, 2147, 664, 1116, 1508, 26, 21,
749, 64, 204, 10083), `Emergency accidents conveyed...19` = c(493,
172, 203, 474, 381, 625, 1597, 436, 823, 961, 22, 14, 421,
49, 145, 6816)), class = c("tbl_df", "tbl", "data.frame"), row.names = c(NA,
-16L))
```r
Any help is extremely appreciated here!