Hello everyone,
I use R and Rmarkdown to generate dynamic reports. I have a problem with one of my figure that I can not resolve:
The figure generated by ggplot2 is not scaled correctly in Rmarkdown. I can obtain good proportion of this figure without Rmarkdown..
My out.width chunk parameter is already 100%, so I don't know what to do to get proportions that I want..
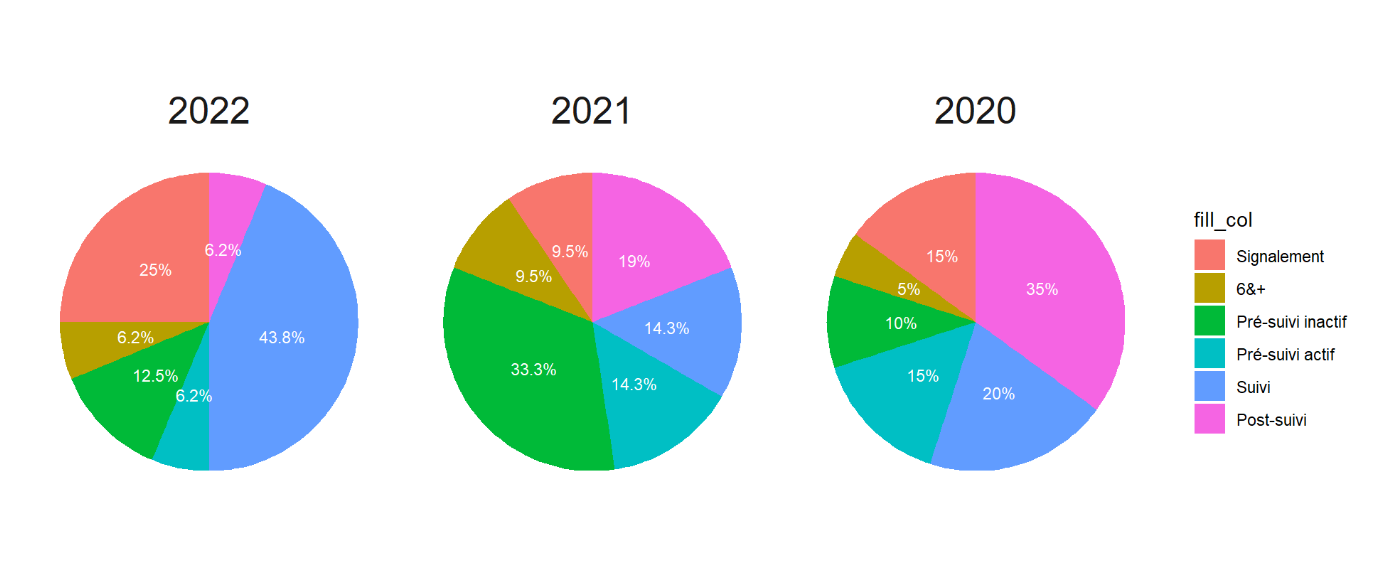
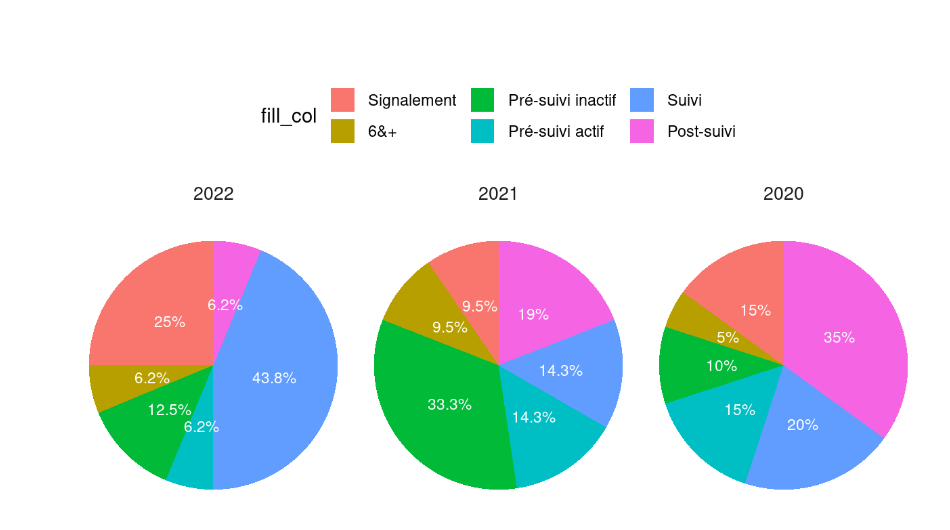
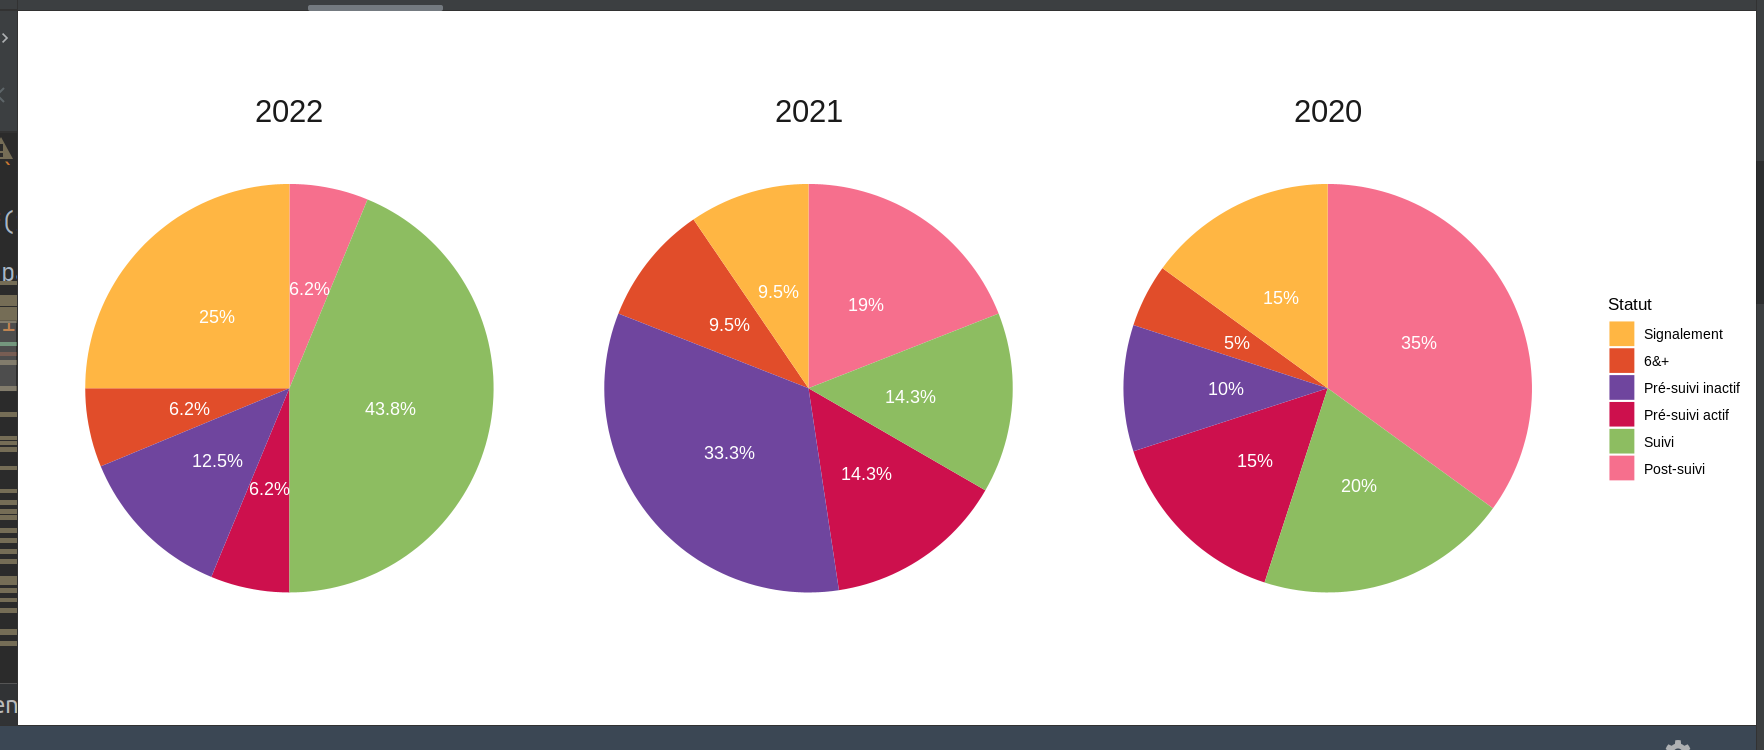
The proportions that I want:
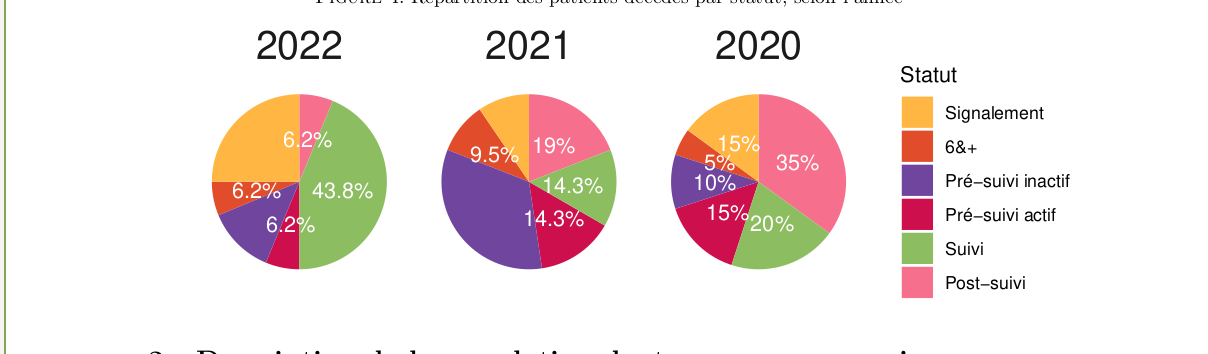
What I get in the PDF rendering:
lang: fr-FR
title: "test"
date: "`r format(Sys.time(), '%d/%m/%y')`"
output:
    pdf_document:
        toc: yes
        number_sections: true
        toc_depth: 3
        fig_caption: yes
---
{r out.width = "100%"}
library(tidyverse)
blank_theme <- theme_minimal()+
  theme(
  axis.title.x = element_blank(),
  axis.title.y = element_blank(),
  panel.border = element_blank(),
  panel.grid=element_blank(),
  axis.ticks = element_blank(),
  plot.title=element_text(size=14, face="bold"),
  )

data <- structure(list(fill_col = structure(c(2L, 2L, 2L, 6L, 6L, 6L, 4L,
4L, 4L, 3L, 3L, 3L, 1L, 1L, 1L, 5L, 5L, 5L), levels = c("Signalement",
"6&+", "Pré-suivi inactif", "Pré-suivi actif", "Suivi", "Post-suivi"
), class = "factor"), facet_col = structure(c(3L, 2L, 1L, 3L, 2L,
1L, 3L, 2L, 1L, 3L, 2L, 1L, 3L, 2L, 1L, 3L, 2L, 1L), levels = c("2022",
"2021", "2020"), class = "factor"), y_col = c(1L, 2L, 1L, 7L,
4L, 1L, 3L, 3L, 1L, 2L, 7L, 2L, 3L, 2L, 4L, 4L, 3L, 7L)), row.names = c(NA,
-18L), class = c("tbl_df", "tbl", "data.frame"))

data <- data %>%
    group_by(facet_col) %>%
    mutate(sum_for_facet_col = sum(y_col, na.rm = TRUE), .groups = "drops")

  ggplot(data, aes(x = "", y = y_col, fill = fill_col)) +
    geom_bar(stat = "identity", width = 1, position = position_fill()) +
    geom_text(aes(label = paste0(round(y_col/sum_for_facet_col *100, digits = 1),"%")),
    size = 4,
    colour = "white",
    check_overlap = TRUE, position = position_fill(vjust = 0.5)) +
    coord_polar(theta = "y")  +
    facet_wrap(~facet_col) +
    blank_theme +
    theme(axis.text.x=element_blank(), strip.text.x = element_text(size = 20))
Thank in advance for your help