I know that a very similar question already exists here, but the provided answer did not work for me.
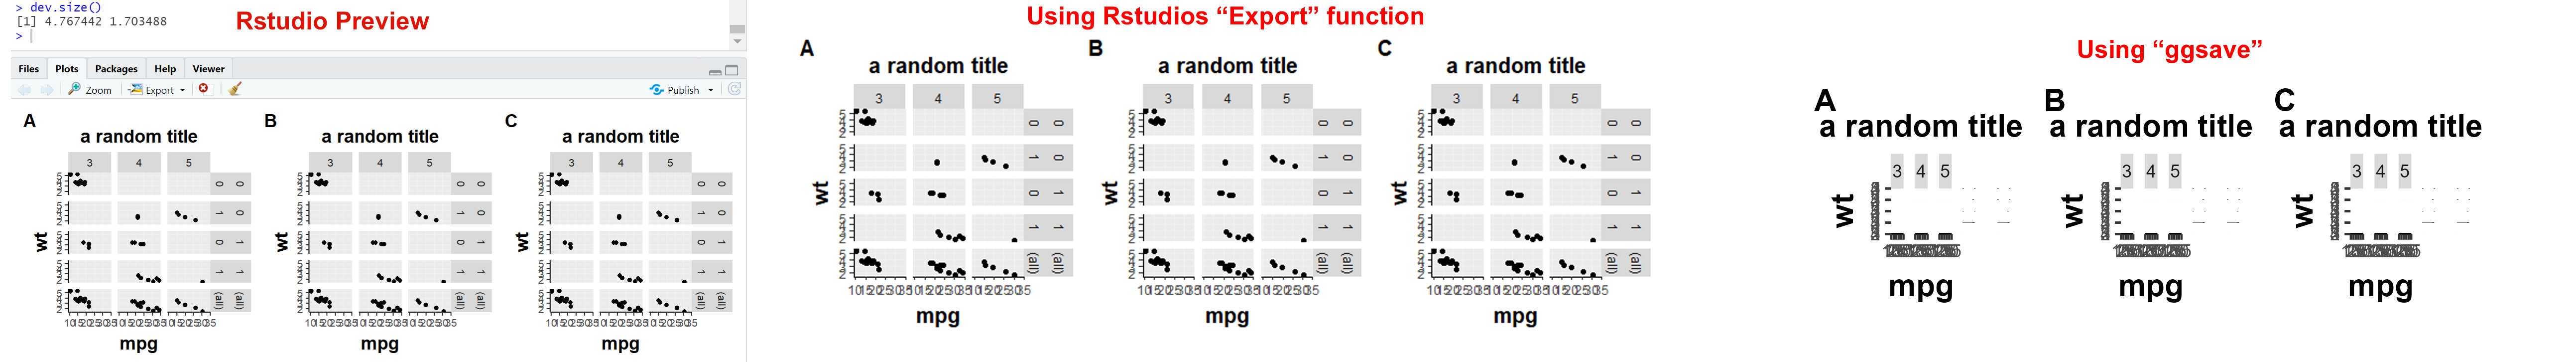
When I want to save a plot, this is my usual workflow: I generate a plot and adjust the size of the plot in the "Plots" Panel of RStudio until I am satisfied. I then call dev.size() to get the exact size.
Afterwards, I save the plot with ggsave(...,dpi=300) and specify the previously determined width and height. The problem is, that after saving, the plot looks completely different, especially the text sizes.
If I use the "Export" option from RStudio the plot looks exactly as it does in the preview, but the quality is quite bad and doing this manually is tedious.
Here is the picture, that hopefully illustrates what I mean:
The code I use to save the plot looks like this:
library(tidyverse)
library(patchwork)
theme_custom <- function(){
  theme(plot.title = element_text(face = "bold",
                                  size = 15, hjust = 0.5),
        axis.title = element_text(face = "bold",size = 15),
        axis.title.y = element_text(angle=90,vjust =2),
        axis.title.x = element_text(vjust = -0.2),
        axis.text = element_text(),
        axis.line = element_line(colour="black"),
        axis.ticks = element_line(),
        panel.grid.major = element_line(colour="#f0f0f0"),
        panel.grid.minor = element_blank()
        )
  }


p1 <- ggplot(mtcars, aes(x = mpg, y = wt)) +
  geom_point() +
  facet_grid(vs + am ~ gear, margins = "vs") +
  theme_custom()+
  ggtitle("a random title")

p2 <- ggplot(mtcars, aes(x = mpg, y = wt)) +
  geom_point() +
  facet_grid(vs + am ~ gear, margins = "vs") +
  theme_custom()+
  ggtitle("a random title")

p3 <- ggplot(mtcars, aes(x = mpg, y = wt)) +
  geom_point() +
  facet_grid(vs + am ~ gear, margins = "vs") +
  theme_custom()+
  ggtitle("a random title")


# NOTE: I use patchwork here to combine the plots, but the problem is the same if I use a single plot..
combined <- wrap_plots(p1, p2, p3, nrow = 1) +
  plot_annotation(tag_levels = "A") &
  theme(plot.tag = element_text(size = 15, face="bold"))

combined

ggsave("plot.png")
I would love to know, if there is an option to "programmatically" save a plot which exactly recreates the "Plots" preview in high quality.
I tried this on a windows and on a linux machine and the result was the same in both cases.
Thanks a lot in advance!