scale_fill_binned throws error if all bins have the same value

I want to print a couple of ggplots in a group_walk loop. But one of the plots only returns values in one bin which resolves in an error.

Here is an example:

library(ggplot2)

data.frame(x = c("a", "b"), 
           y = c("A", "B")) |> 
  ggplot() + 
  geom_tile(aes(x = x, y = y, fill = after_stat(count)), stat = "bin2d") + 
  scale_fill_binned()
#> Error in cut.default(x, breaks, labels = FALSE, include.lowest = TRUE, : ungültige Anzahl von Intervallen

Created on 2022-11-28 with reprex v2.0.2

If there is a bin with a different number, the plot succeeds:

library(ggplot2)

data.frame(x = c("a", "b", "b"), 
           y = c("A", "B", "B")) |> 
  ggplot() + 
  geom_tile(aes(x = x, y = y, fill = after_stat(count)), stat = "bin2d") + 
  scale_fill_binned()

Created on 2022-11-28 with reprex v2.0.2

Is this a ggplot2 bug? What can I do to get around it?

Regards
SebNeu

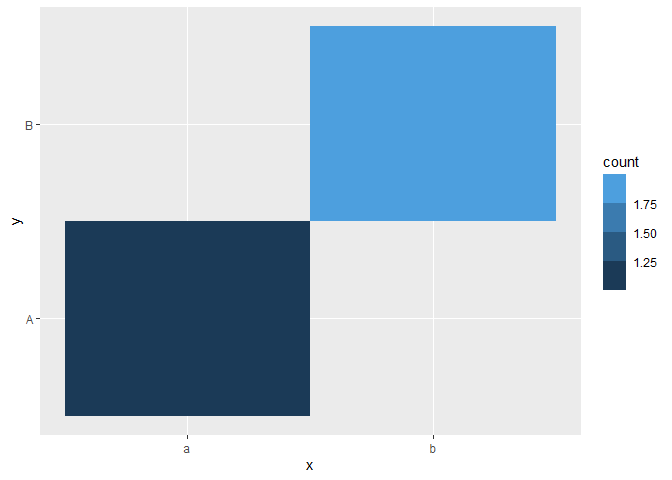
This solution is admittedly a bit of a hack, but I think it gets around the issue of all bins having the same value. Distinct counts of the first variable are checked. If all counts are the same (length(n) = 1), a dummy data frame is created with the first value of x repeated n + 1 times and bound to the data frame to plot. Then, in the plot, the newly added data is "hidden" by setting x and y limits in coord_cartesian. I'm not sure how well this generalizes, but I hope it provides a work-around or inspires a different way to solve your issue.

library(tidyverse)

df = data.frame(x = c("a", "b"), 
                y = c("A", "B"))

 # determine distinct count(s)
n = df %>% count(x) %>% distinct(n) %>% pull(n)

# establish new data frame to plot
d = df

# if all values have the same count (length = 1)
# create a dummy data frame with counts n + 1
# bind to the data frame to plot
if(length(n) == 1) {
  dummy = data.frame(x = rep(df$x[1], n + 1),
                     y = rep(NA, n + 1))
  
  d = bind_rows(df, dummy)  
}

# resulting data frame to plot
d
#>   x    y
#> 1 a    A
#> 2 b    B
#> 3 a <NA>
#> 4 a <NA>

# create plot and "hide" the dummy data via coord_cartesian
ggplot(d) + 
  geom_tile(aes(x = x, y = y, fill = after_stat(count)), stat = "bin2d") + 
  coord_cartesian(xlim = c(0.5, n_distinct(df$x) + 0.5), 
                  ylim = c(0.5, n_distinct(df$y) + 0.5), 
                  expand = F) +
  scale_fill_binned()

image

Created on 2022-12-10 with reprex v2.0.2.9000

Wow, thank you for your time and the solution. Yes, it seems a bit hacky. But anyway, it does it's job.

Meanwhile there was a pull request in the git repository which will fix this issue, too.

Regards
SebNeu

1 Like

This topic was automatically closed 21 days after the last reply. New replies are no longer allowed.

If you have a query related to it or one of the replies, start a new topic and refer back with a link.