I am working with the R programming language.
Suppose:
- There is a coin where if it lands head then the probability of the next flip being heads is 0.6 (and if tails then the next flip being tails is also 0.6)
- There are 100 students in a class
- Each student flips this coin a random number of times
- The last flip of student_n does not influence the first flip of student_n+1 (i.e. when the next student flips the coin, the first flip has 0.5 probability of heads or tails, but the next flip for this student depends on the previous flip)
Here is some R code to represent this problem:
library(tidyverse)

set.seed(123)
ids <- 1:100
student_id <- sort(sample(ids, 100000, replace = TRUE))
coin_result <- character(1000)
coin_result[1] <- sample(c("H", "T"), 1)

for (i in 2:length(coin_result)) {
  if (student_id[i] != student_id[i-1]) {
    coin_result[i] <- sample(c("H", "T"), 1)
  } else if (coin_result[i-1] == "H") {
    coin_result[i] <- sample(c("H", "T"), 1, prob = c(0.6, 0.4))
  } else {
    coin_result[i] <- sample(c("H", "T"), 1, prob = c(0.4, 0.6))
  }
}

#tidy up
my_data <- data.frame(student_id, coin_result)
my_data <- my_data[order(my_data$student_id),]

final <- my_data %>%
    group_by(student_id) %>%
    mutate(flip_number = row_number())
From this data, we can count the number of times sequences of HH, HT, TH and TT occurred:
head(my_data)
# A tibble: 6 x 3
# Groups:   student_id [1]
  student_id coin_result  flip_number
       <int> <chr>              <int>
1          1 H                      1
2          1 H                      2
3          1 H                      3
4          1 H                      4
5          1 T                      5
6          1 H                      6

my_data %>%
  group_by(student_id) %>%
  summarize(Sequence = str_c(coin_result, lead(coin_result)), .groups = 'drop') %>%
  filter(!is.na(Sequence)) %>%
  count(Sequence)

# A tibble: 4 × 2
  Sequence     n
  <chr>    <int>
1 HH       29763
2 HT       19782
3 TH       19775
4 TT       30580
My Problem: Using this data, I am trying to accomplish the following task:
- Step 1: Using sampling with replacement, select 100 students
- Step 2: For a given student that is selected in Step 1, randomly choose a position in their sequence of flips (e.g. call this position "x")
- Step 3: For this same student, randomly choose a second position in their sequence of flips (e.g. call this position "y") such that y > x (i.e. "y" comes after "x").
- Step 4: Repeat Step 2 and Step 3 for all students selected in Step 1
- Step 5: Count the number of times sequences of HH, HT, TH and TT occurred for all students selected in Step 1
- Step 6: Repeat Step 1 - Step 5 many times (e.g. 1000 times)
As an example, suppose Student 15 has 6 Flips : H, H, T, H, T, T - if x = 2 and y = 5, then we would have H, T, H, T
Here is my own attempt at solving my problem:
# Set the number of iterations
k <- 1000

# Initialize a data frame
results <- data.frame(iteration_number = numeric(0),
                      h_given_h = numeric(0),
                      h_given_t = numeric(0),
                      t_given_h = numeric(0),
                      t_given_t = numeric(0))

# Set the number of students to sample
n_students <- length(unique(my_data$student_id))

# Loop over the number of iterations
for (i in 1:k) {
  # Randomly sample student ids with replacement
  sampled_ids <- sample(ids, n_students, replace = TRUE)

  # Initialize a data frame to store the sampled data
  sampled_data <- data.frame(student_id = integer(0), coin_result = character(0), stringsAsFactors = FALSE)

  # LOOP
  for (j in sampled_ids) {
    # Get data for the current student
    student_data <- my_data[my_data$student_id == j, ]

    # Randomly choose a starting and ending point
    x <- sample(nrow(student_data), 1)
    y <- sample(x:nrow(student_data), 1)

    # Select the data between the starting and ending point
    selected_data <- student_data[x:y, ]

    # Append the selected data to the sampled data frame
    sampled_data <- rbind(sampled_data, selected_data)
  }

  final <- sampled_data %>%
    group_by(student_id) %>%
    mutate(flip_number = row_number())

  # Calculate the conditional probabilities
  cond_prob <- final %>%
    group_by(student_id) %>%
    summarize(Sequence = str_c(coin_result, lead(coin_result)), .groups = 'drop') %>%
    filter(!is.na(Sequence)) %>%
    count(Sequence) %>%
    mutate(prob = n / sum(n))

  # Extract probabilities
  p_HH <- cond_prob$prob[cond_prob$Sequence == "HH"]
  p_HT <- cond_prob$prob[cond_prob$Sequence == "HT"]
  p_TH <- cond_prob$prob[cond_prob$Sequence == "TH"]
  p_TT <- cond_prob$prob[cond_prob$Sequence == "TT"]

  #print(i)
  # Append
  results[i, ] <- c(i, p_HH, p_HT, p_TH, p_TT)
}

colnames(results) <- c("iteration_number", "h_given_h", "h_given_t", "t_given_h", "t_given_t")

library(ggplot2)

# Convert to long
results_long <- tidyr::pivot_longer(results, cols = c(h_given_h, h_given_t, t_given_h, t_given_t), names_to = "condition", values_to = "probability")

# Plot
ggplot(results_long, aes(x = iteration_number, y = probability, color = condition)) +
  geom_line() +
  labs(x = "Iteration", y = "Probability", color = "Condition")
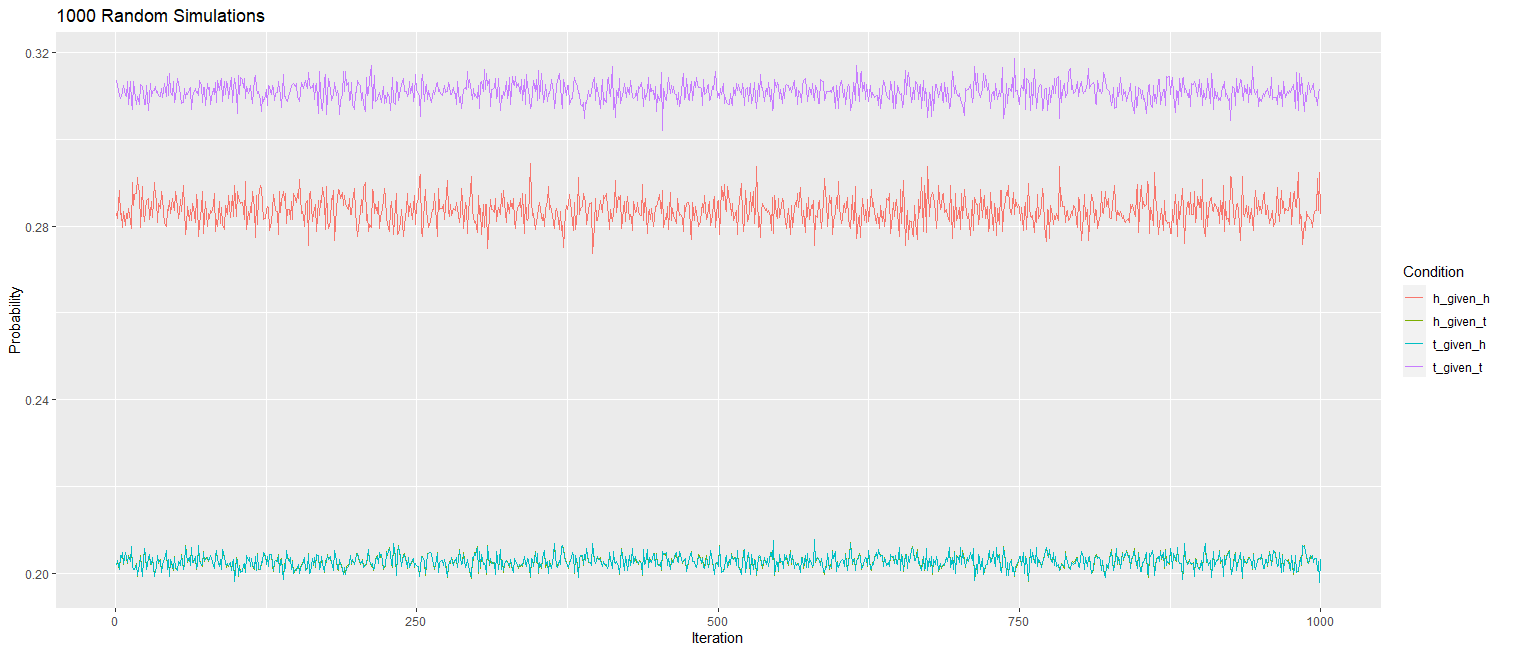
My Question: While the code seems to have run, I am not sure if I have done this correctly. Can someone please help me confirm this?
For example - shouldn't the lines for HH and TT be almost identical .... and shouldn't the lines of TH and HT be almost identical? Yet in my graph, this clearly not the case? The way I see it, within a given iteration, if the same student appears 3 times in the re-sampled dataset, the last transition from the first time will "leak" into the the first transition from the second time and thus compromise the results.
Thanks!