stop automatically ordering of x-axis

Hi,

I have data like

  date   NCORE_abs_365 PILS_abs_365
  <chr>          <dbl>        <dbl>
1 30-May         0.922         2.27
2 11-Jun         0.701         3.61
3 20-Jun         0.998         3.92
4 29-Jun        20.4          17.5 
5 23-Jul        11.9           6.90
6 26-Jul         4.42          6.03

I am trying to get simple line plot via

comaprison_daily %>% 
  gather(variable, value, NCORE_abs_365:PILS_abs_365) %>% 
  ggplot(aes(x = date, y = value, group = variable, color = variable)) +
  geom_point(aes(colour = variable),size = 3)+   #geom_line()+ #geom_smooth()+ 
  geom_line(aes(color = variable), size = 1) + 
  theme(legend.text=element_text(size=12)) + 
  theme(legend.position = c(0.25, 0.85)) +
  theme(axis.title = element_text(face="plain",size=14,color="black"),
        axis.text=element_text(size=12,face="plain", color="black"),
        axis.text.x=element_text(hjust=0.0, angle = -45),
        plot.title = element_text(size=15)) +
  theme(legend.title=element_blank()) + #for legend titlte labs(color = "")
  #theme(panel.background = element_rect(colour = "black", size=1)) + 
  #theme(panel.background = element_rect(fill = "white")) +  
  #scale_color_brewer(palette="Set1")+
  ylab(bquote("Abs"[(365*nm)]~ '('*M*m^-1*')')) +
  xlab(bquote('2019'**'')) + labs(colour=c('NCORE', 'PILS')) +
  labs(title = "") 

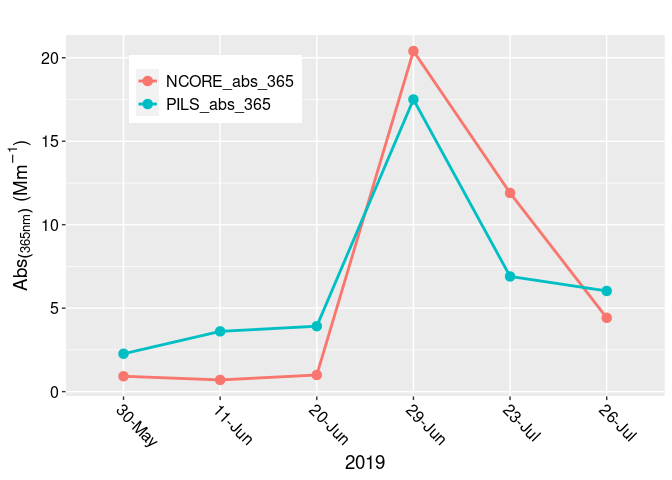
But x-axis is coming alphabetically, like in the figure

I want to avoid it. I want to make the order of the x-axis as it is given in the data, not as alphabetically.

Any thoughts

Thanks

A quick workaround is to use forcats::fct_inorder()

library(tidyverse)

comaprison_daily <- data.frame(
  stringsAsFactors = FALSE,
              date = c("30-May","11-Jun","20-Jun",
                       "29-Jun","23-Jul","26-Jul"),
     NCORE_abs_365 = c(0.922, 0.701, 0.998, 20.4, 11.9, 4.42),
      PILS_abs_365 = c(2.27, 3.61, 3.92, 17.5, 6.9, 6.03)
)

comaprison_daily %>% 
    gather(variable, value, NCORE_abs_365:PILS_abs_365) %>% 
    ggplot(aes(x = fct_inorder(date), y = value, group = variable, color = variable)) +
    geom_point(aes(colour = variable),size = 3)+   #geom_line()+ #geom_smooth()+ 
    geom_line(aes(color = variable), size = 1) + 
    theme(legend.text=element_text(size=12)) + 
    theme(legend.position = c(0.25, 0.85)) +
    theme(axis.title = element_text(face="plain",size=14,color="black"),
          axis.text=element_text(size=12,face="plain", color="black"),
          axis.text.x=element_text(hjust=0.0, angle = -45),
          plot.title = element_text(size=15)) +
    theme(legend.title=element_blank()) + #for legend titlte labs(color = "")
    #theme(panel.background = element_rect(colour = "black", size=1)) + 
    #theme(panel.background = element_rect(fill = "white")) +  
    #scale_color_brewer(palette="Set1")+
    ylab(bquote("Abs"[(365*nm)]~ '('*M*m^-1*')')) +
    xlab(bquote('2019'**'')) + labs(colour=c('NCORE', 'PILS')) +
    labs(title = "")

Created on 2022-08-31 with reprex v2.0.2

1 Like

Thanks for
forcats::fct_inorder()

This topic was automatically closed 42 days after the last reply. New replies are no longer allowed.

If you have a query related to it or one of the replies, start a new topic and refer back with a link.