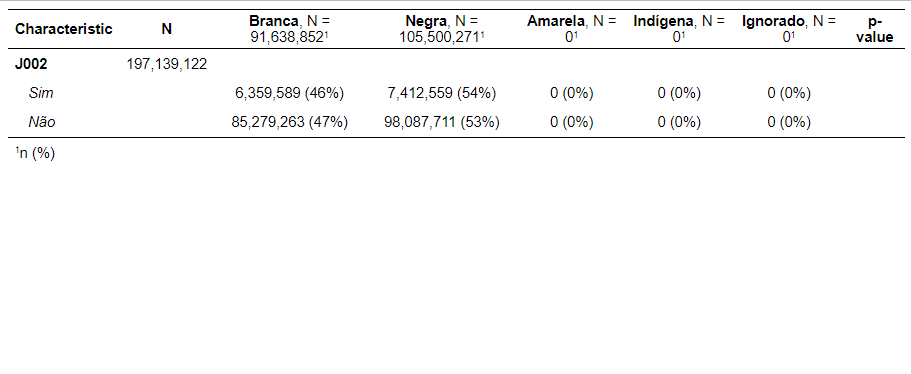
Hi there. I'm trying to create a table using the PNSIBGE packages, in which the get_pns function returns an object of the survey class (the same as the svydesign function), {srvyr}, which allows working with dplyr functions, and {gtsummary}. I'm trying to aggregate "Preto" (Black) and "Pardo" (Brown) race categories from the National Health Survey (PNS), in Brazil, into the "Negra" category. As the code I made, they are correctly recoded and grouped. However, when filtering only "Branca" (White) and "Negra" and passing it to the tbl_svysummary function, the filter ends up not working. The unfiltered categories is appearing in the table as zero (0). "Amarelo" (Yellow), e "Indígena" (Indigenous), and "Ignorado" should not appear in the table. Would anyone have a solution? Here are the codes for reproduction.
rm(list = ls())
library(tidyverse)
library(PNSIBGE)
library(srvyr)
library(gtsummary)
library(flextable)

vars <- c("V0001", "C009","J002")

pns.13 <- PNSIBGE::get_pns(year = 2013, vars = vars)

class(pns.13)

pns.13 %>%
  srvyr::as_survey_design() %>%
  mutate(C009 = recode(C009, "Preta" = "Negra", "Parda" = "Negra")) %>%
  filter(C009 %in% c("Branca", "Negra")) %>%
#  drop_na(C009) %>%
  tbl_svysummary(by = "C009", # strtification variable.
                 include = c("J002"),
                 percent = "row",  #Column or Row percentage, depending on your needs
                 statistic = list(all_continuous() ~ "{mean} ({sd})",
                            all_categorical() ~ "{n} ({p}%)")
                 ) %>%
  add_p() %>%
  add_n() %>%
  bold_labels() %>%
  italicize_levels() %>%
  as_flex_table() %>%
  set_table_properties(width = 1, layout = "autofit")
And this is the result I'm getting. I want without the "Amarelo", "Indigena" and "Ignorado" categories, which have value zero (0).
Edit after-postage*
I discovered that I can do what I want with fct_drop. But, even this function is not working in the above example. I don `t understand why. It works in this example
survey::svydesign(
ids = ~1,
data = select(as.data.frame(Titanic), -c(Sex, Age)),
weights = ~Freq
) %>%
srvyr::as_survey_design() %>%
dplyr::filter(Class %in% c("1st", "2nd")) %>%
mutate(Class = fct_drop(Class)) %>%
gtsummary::tbl_svysummary(by = Survived) %>%
gtsummary::add_p() %>%
gtsummary::modify_spanning_header(
all_stat_cols() ~ "Survived")