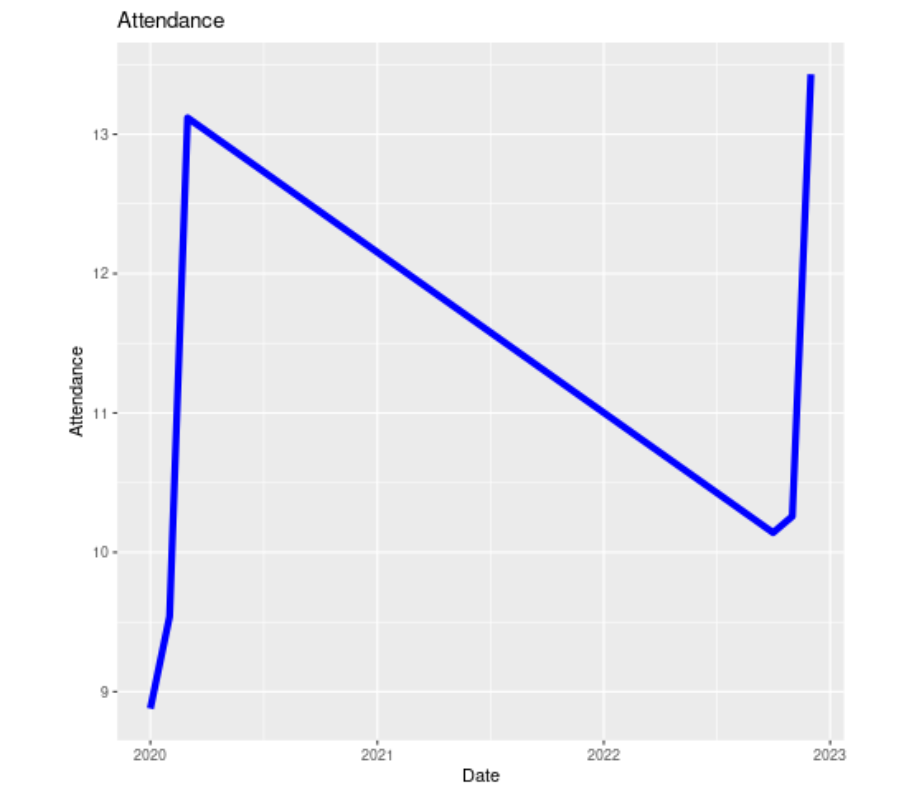
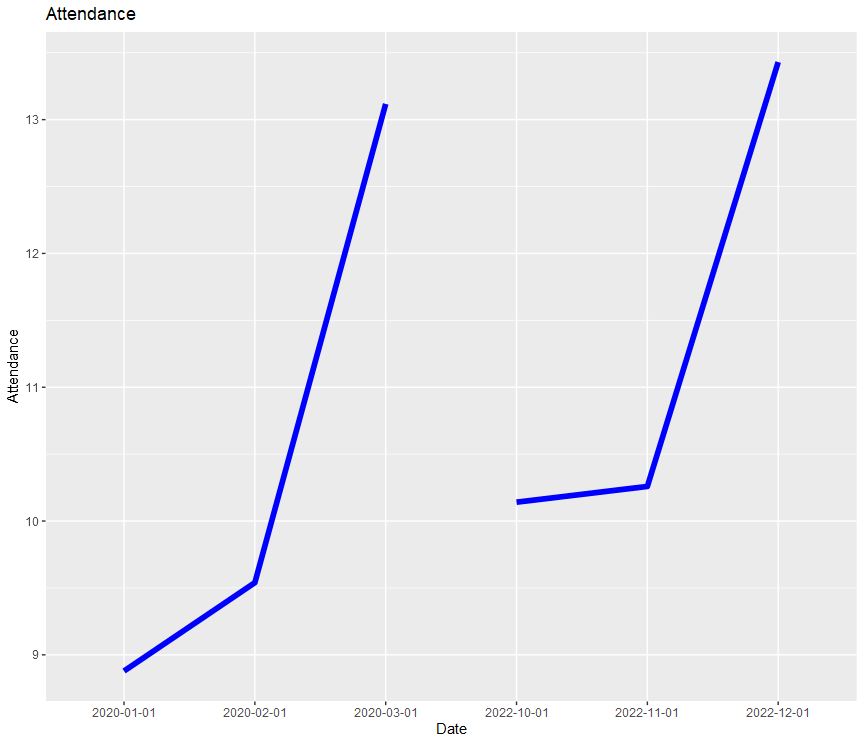
Hi. I want to plot a time series line graph where there is a large gap in the time sequence because there was no data, such as no movie attendance during Covid. I would like to compress the x-axis for the gap period, and not connect the line. Here is some code so far. Thank you.
set.seed(123)
library(ggplot2)
df <- data.frame(
date = c("01-01-2020", "02-01-2020", "03-01-2020", "10-01-2022", "11-01-2022","12-01-2022"),
value = rnorm(6, mean=10, sd=2) )
df$date <- as.Date(df$date, format = "%m-%d-%Y")
ggplot(df, aes(x=date, y=value)) +
geom_line(size=2, color="blue") +
labs(title="Attendance", x="Date", y="Attendance")