I have some data that I need to transform into a specific "shape".
The issue is that only 2 of my 5 datasets have a good fits. I just created the account and therefore am only allowed to post one image so bear with me. Here is the image I am going to reference to describe the issue:
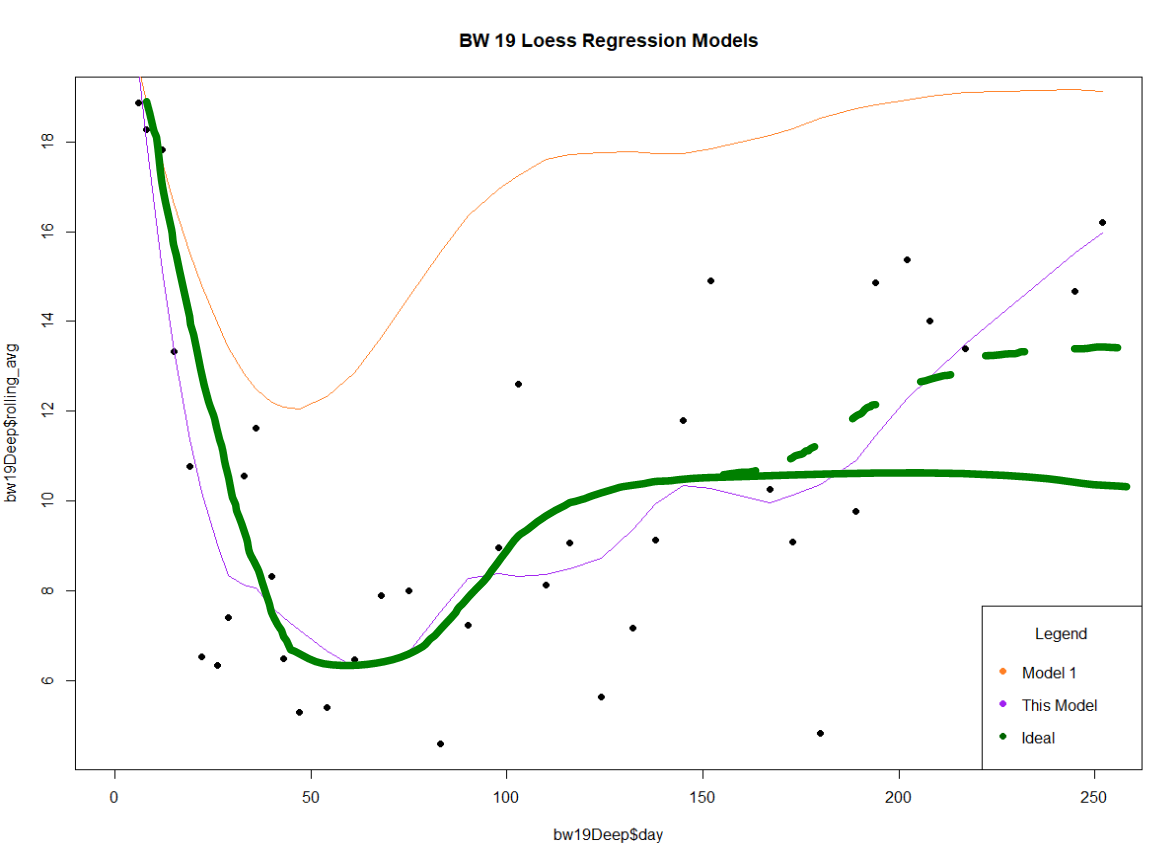
where the orange "Model 1" line is a smoothed representation of one of my "good" datasets, the purple "This Model" line is a smoothed representation of the dataset plotted, the green "Ideal" line is what this smoothed dataset should look like, and the green dashed line is just an alternate tail that matches the shape of "Model 1".
I tried changing around α within a Loess regression but wasn't able to get the results I need, I tried a polynomial regression but the valley occurs too late (around day 150). Does anyone have any suggestions or other interpretation methods that may help me smooth my data either like the green lines, or a method to smooth data biased towards the shape of "Model 1"? Again, the most important values are the first valley, followed by the time and y value of the initial plateau after that valley.