AC3112
1
Hi All,
I wondered if there exists a simple method for transforming base output in R into a nicer GGplot themed plot (such as theme_ipsum)?
Would appreciate any/all feedback on this given the PCA base plot example below.
install.packages("Gifi")
library(Gifi)

ABC6 <- ABC[,6:11]
fitord <- princals(ABC6)
plot(fitord)
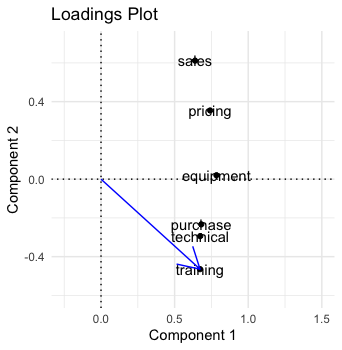
Some tedium involved. Partial example
library(Gifi)
library(ggplot2)

fitord <- as.data.frame(princals(ABC[,6:11)$weights)
p <- ggplot(fitord,aes(D1,D2, label = rownames(fitord)))
p +
  geom_point() +
  xlim(-0.25,1.5) +
  ylim(-0.6,0.7) +
  labs(title = "Loadings Plot") +
  xlab("Component 1") +
  ylab("Component 2") +
  geom_hline(yintercept = 0, lty = "dotted") +
  geom_vline(xintercept = 0, lty = "dotted") +
  geom_text() +
  annotate("segment", x = 0, xend = fitord[4,1], y = 0, yend = fitord[4,2],
           arrow = arrow(), colour = "blue") +
  theme_minimal()
AC3112
3
Thanks @technocrat. Really appreciate your help. Very useful overall 
1 Like
system
Closed
4
This topic was automatically closed 7 days after the last reply. New replies are no longer allowed.
If you have a query related to it or one of the replies, start a new topic and refer back with a link.