Trouble with creating a table

Description of issue -

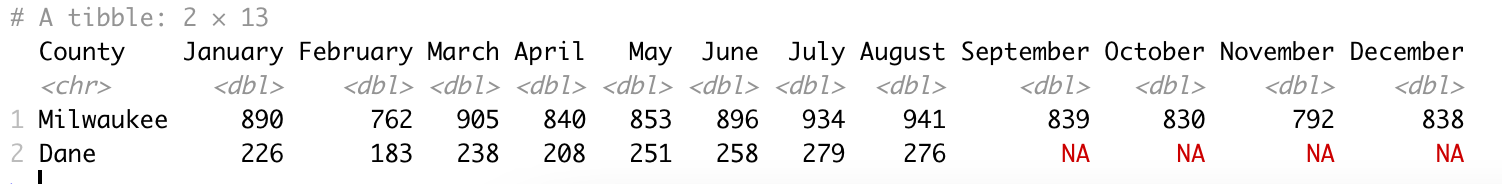
I am brand new to RStudio and I am trying to create a table with month as my rows, county as my columns and have the incidents reported fill out the table. When I import my CSV into the environment it shows all of the correct incident numbers for each month and county, but when I put it into a table it shows every incident as "1".
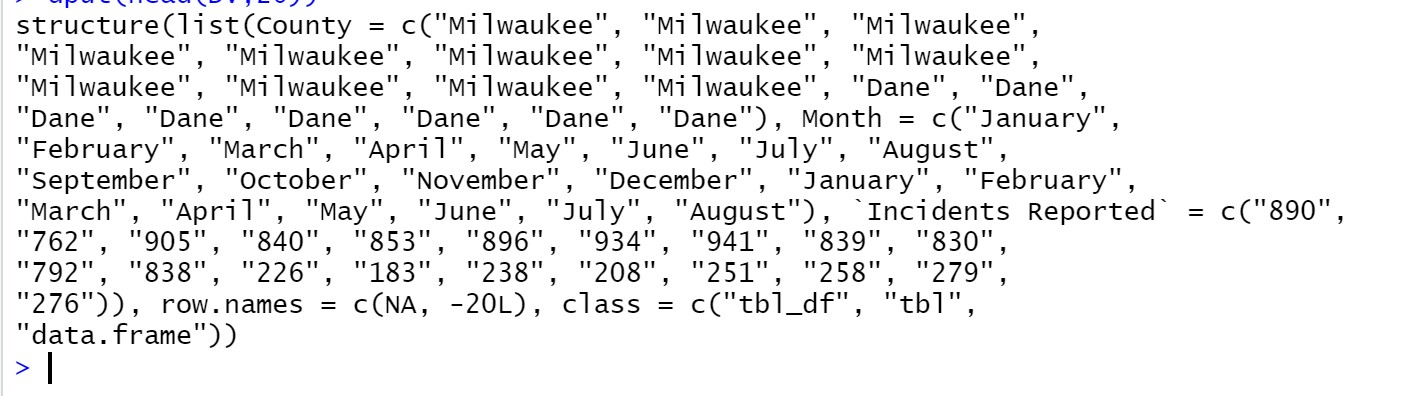
I imported my file with
DV <- read_csv("~/DV_excel_viz.csv", col_types = cols(Incidents Reported = col_integer()))

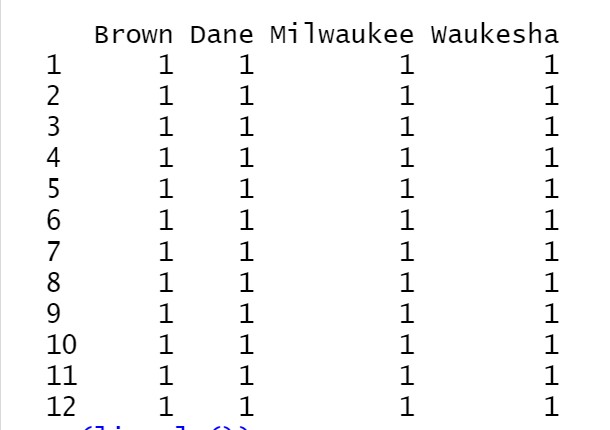
and I used myTable<-table(DV$Month, DV$County) to get a table.

Attached is apicture of the table it created. Not sure what I am doing wrong and could really use advice! (For reference the top row of data should say 62, 226, 890, 91)

table

Can you paste part of your code using this code?
dput(head(DV, 20)

HI @Rnewbie12,
Welcome to the RStudio Community Forum.

The table() function only produces a table of counts (frequencies) - not your raw incident data. See below for other options:

# Make some dummy data
DV <- data.frame(Month = c(rep(1:4, times=3)), 
                 County = c(rep(c("aa","bb","cc"), each=4)),
                 Incidents = sample(50:150, 12))
DV
#>    Month County Incidents
#> 1      1     aa        54
#> 2      2     aa        86
#> 3      3     aa        85
#> 4      4     aa        88
#> 5      1     bb       115
#> 6      2     bb        61
#> 7      3     bb       130
#> 8      4     bb       114
#> 9      1     cc       108
#> 10     2     cc        95
#> 11     3     cc        98
#> 12     4     cc       104

table(DV$Month, DV$County) # This is a table of *counts* for each combination of Month/County
#>    
#>     aa bb cc
#>   1  1  1  1
#>   2  1  1  1
#>   3  1  1  1
#>   4  1  1  1
# See: help(table)

# A simple 2D representation of the data (but not nicely labelled)
matrix(data=DV$Incidents, nrow=4, ncol=3)
#>      [,1] [,2] [,3]
#> [1,]   54  115  108
#> [2,]   86   61   95
#> [3,]   85  130   98
#> [4,]   88  114  104

# Add some better row/col labels
matrix(data=DV$Incidents, nrow=4, ncol=3, dimnames=list(c(1:4), c("aa","bb","cc")))
#>   aa  bb  cc
#> 1 54 115 108
#> 2 86  61  95
#> 3 85 130  98
#> 4 88 114 104

# A method of obtaining the desired output but in data.frame (tibble) format
suppressPackageStartupMessages(library(tidyverse))

DV %>% 
  pivot_wider(names_from=County, values_from=Incidents)
#> # A tibble: 4 × 4
#>   Month    aa    bb    cc
#>   <int> <int> <int> <int>
#> 1     1    54   115   108
#> 2     2    86    61    95
#> 3     3    85   130    98
#> 4     4    88   114   104

Created on 2022-10-11 with reprex v2.0.2

1 Like

Here is what occurred when I used that code.

Great, copy that code from "structure" til the end and paste it here

Here is the code!

structure(list(County = c("Milwaukee", "Milwaukee", "Milwaukee",
"Milwaukee", "Milwaukee", "Milwaukee", "Milwaukee", "Milwaukee",
"Milwaukee", "Milwaukee", "Milwaukee", "Milwaukee", "Dane", "Dane",
"Dane", "Dane", "Dane", "Dane", "Dane", "Dane"), Month = c("January",
"February", "March", "April", "May", "June", "July", "August",
"September", "October", "November", "December", "January", "February",
"March", "April", "May", "June", "July", "August"), Incidents Reported = c("890",
"762", "905", "840", "853", "896", "934", "941", "839", "830",
"792", "838", "226", "183", "238", "208", "251", "258", "279",
"276")), row.names = c(NA, -20L), class = c("tbl_df", "tbl",
"data.frame"))

Is this the result you expect?

a <- structure(list(County = c("Milwaukee", "Milwaukee", "Milwaukee", "Milwaukee", "Milwaukee", "Milwaukee", "Milwaukee", "Milwaukee", "Milwaukee", "Milwaukee", "Milwaukee", "Milwaukee", "Dane", "Dane", "Dane", "Dane", "Dane", "Dane", "Dane", "Dane"), 
               Month = c("January", "February", "March", "April", "May", "June", "July", "August", "September", "October", "November", "December", "January", "February", "March", "April", "May", "June", "July", "August"), 
               Incidents_Reported = c("890", "762", "905", "840", "853", "896", "934", "941", "839", "830", "792", "838", "226", "183", "238", "208", "251", "258", "279", "276")), 
          row.names = c(NA, -20L),
          class = c("tbl_df", "tbl", "data.frame"))


library(tidyverse)
a %>% 
  mutate(Incidents_Reported = as.numeric(Incidents_Reported)) %>% 
  pivot_wider(names_from = "Month", values_from = Incidents_Reported)

Yes! I am trying to get that result in order to make it into a stacked bar chart.

This topic was automatically closed 42 days after the last reply. New replies are no longer allowed.

If you have a query related to it or one of the replies, start a new topic and refer back with a link.