Hello,
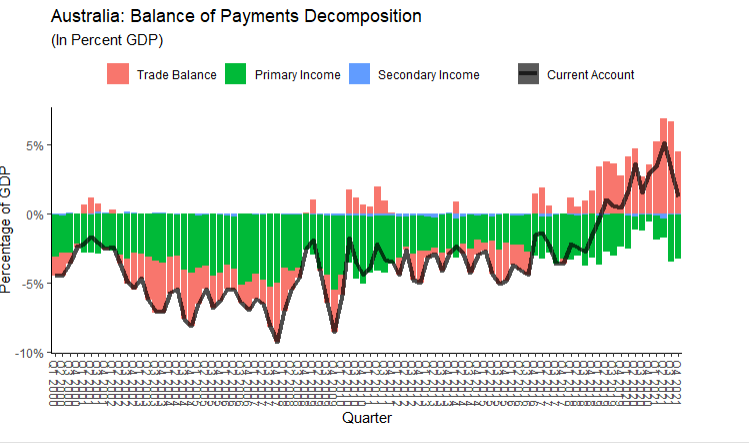
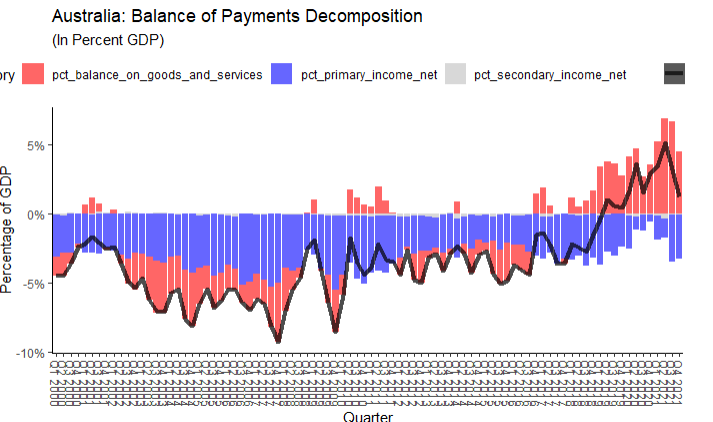
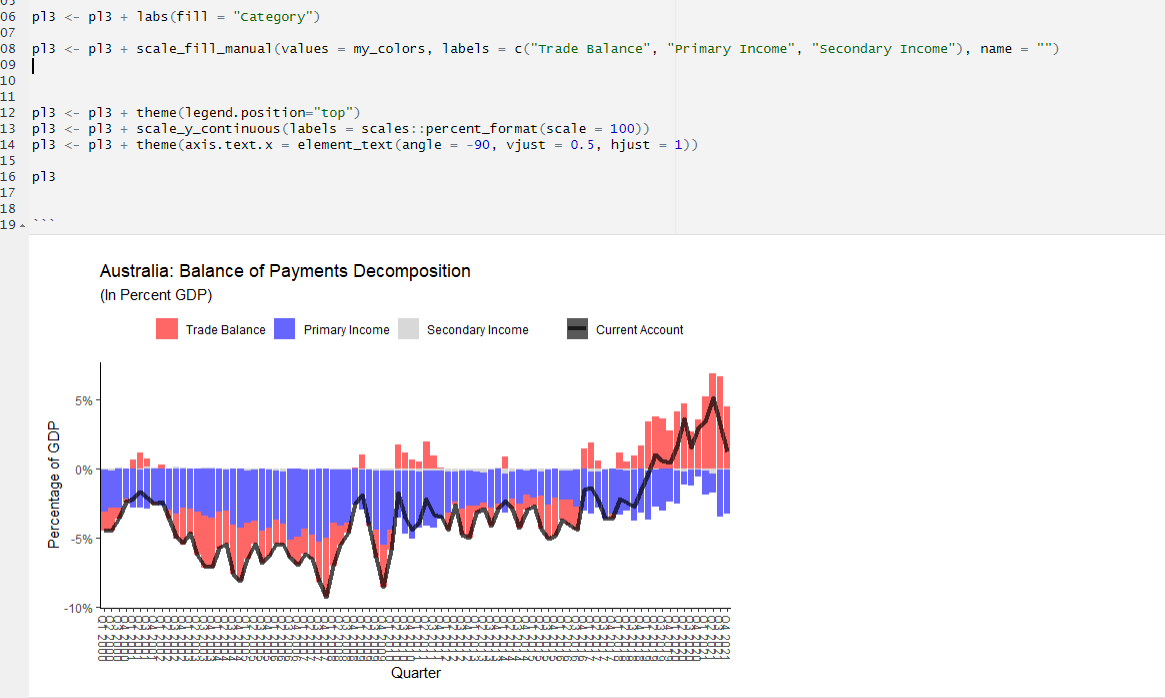
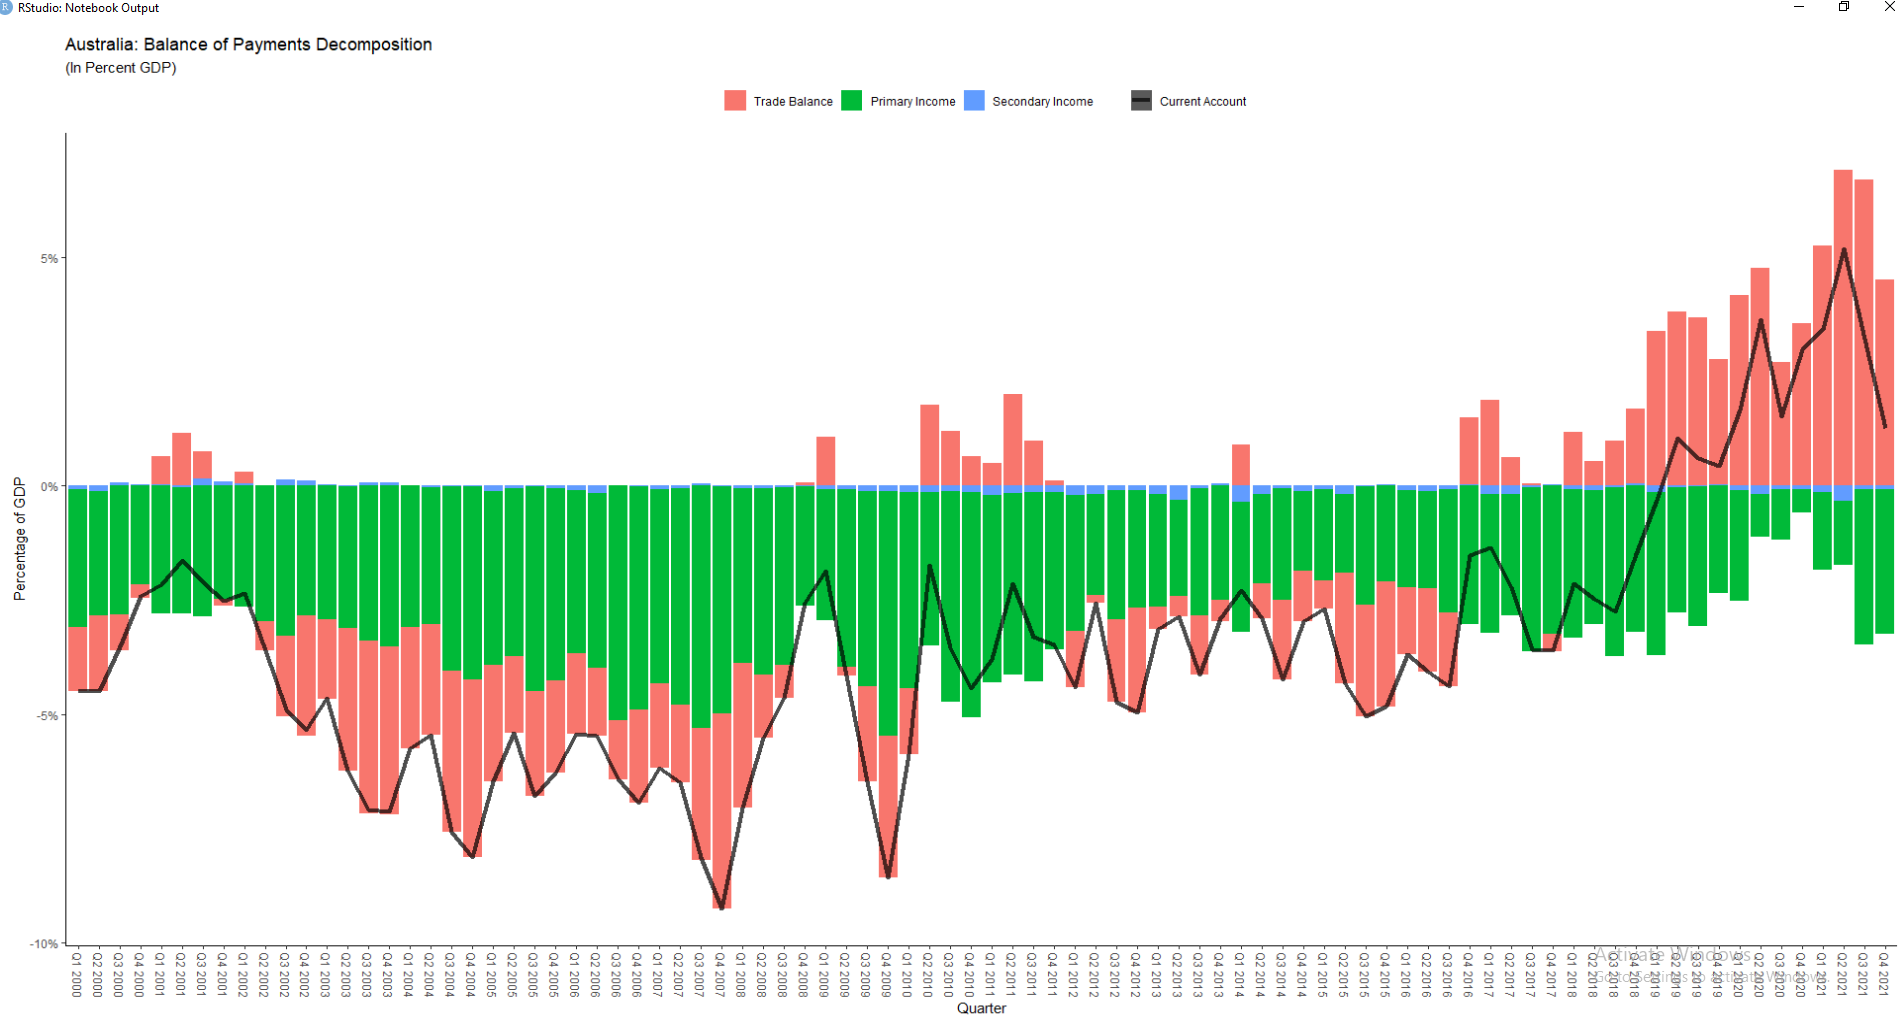
I'm trying to change the columns of my bar graph to red, blue and grey. However, I can't seem to get the colors to change on the output
Attached is a photo of the graph
Also the code and first 100 rows of my data set.
# open file for Australia
# I cleaned this file by hand
dat1 <- read_excel("Australia_BOP.xlsx")
# dput(dat1)
# dput(head(dat1, 100))
# create the percentage of gdp columns
dat1$pct_current_account <- dat1$current_account / dat1$nominal_gdp
dat1$pct_balance_on_goods_and_services <- dat1$balance_on_goods_and_services / dat1$nominal_gdp
dat1$pct_primary_income_net <- dat1$primary_income_net / dat1$nominal_gdp
dat1$pct_secondary_income_net <- dat1$secondary_income_net / dat1$nominal_gdp
# select a smaller subset of our original data frame
dat2 <- dat1[, c("year", "pct_current_account", "pct_balance_on_goods_and_services", "pct_primary_income_net","pct_secondary_income_net")]
# change to long form
# have our indexes be "year" and "pct_current_account"
dat3 <- melt(dat2, id.vars = c("year", "pct_current_account"),
variable.name = "category",
value.name = "total_percent_gdp")
# dat3
theme_set(theme_classic())
# colors are red(#ff6666), blue(#6666ff), grey(#d8d8d8)
my_colors = c("#ff6666", "#6666ff", "#d8d8d8")
# make the plot
pl1 <- ggplot(data = dat3, aes(fill = category, x = factor(year, level = c("Q1 2000", "Q2 2000", "Q3 2000", "Q4 2000",
"Q1 2001", "Q2 2001", "Q3 2001", "Q4 2001",
"Q1 2002", "Q2 2002", "Q3 2002", "Q4 2002",
"Q1 2003", "Q2 2003", "Q3 2003", "Q4 2003",
"Q1 2004", "Q2 2004", "Q3 2004", "Q4 2004",
"Q1 2005", "Q2 2005", "Q3 2005", "Q4 2005",
"Q1 2006", "Q2 2006", "Q3 2006", "Q4 2006",
"Q1 2007", "Q2 2007", "Q3 2007", "Q4 2007",
"Q1 2008", "Q2 2008", "Q3 2008", "Q4 2008",
"Q1 2009", "Q2 2009", "Q3 2009", "Q4 2009",
"Q1 2010", "Q2 2010", "Q3 2010", "Q4 2010",
"Q1 2011", "Q2 2011", "Q3 2011", "Q4 2011",
"Q1 2012", "Q2 2012", "Q3 2012", "Q4 2012",
"Q1 2013", "Q2 2013", "Q3 2013", "Q4 2013",
"Q1 2014", "Q2 2014", "Q3 2014", "Q4 2014",
"Q1 2015", "Q2 2015", "Q3 2015", "Q4 2015",
"Q1 2016", "Q2 2016", "Q3 2016", "Q4 2016",
"Q1 2017", "Q2 2017", "Q3 2017", "Q4 2017",
"Q1 2018", "Q2 2018", "Q3 2018", "Q4 2018",
"Q1 2019", "Q2 2019", "Q3 2019", "Q4 2019",
"Q1 2020", "Q2 2020", "Q3 2020", "Q4 2020",
"Q1 2021", "Q2 2021", "Q3 2021", "Q4 2021")), y = total_percent_gdp)) + scale_color_manual(values = my_colors)
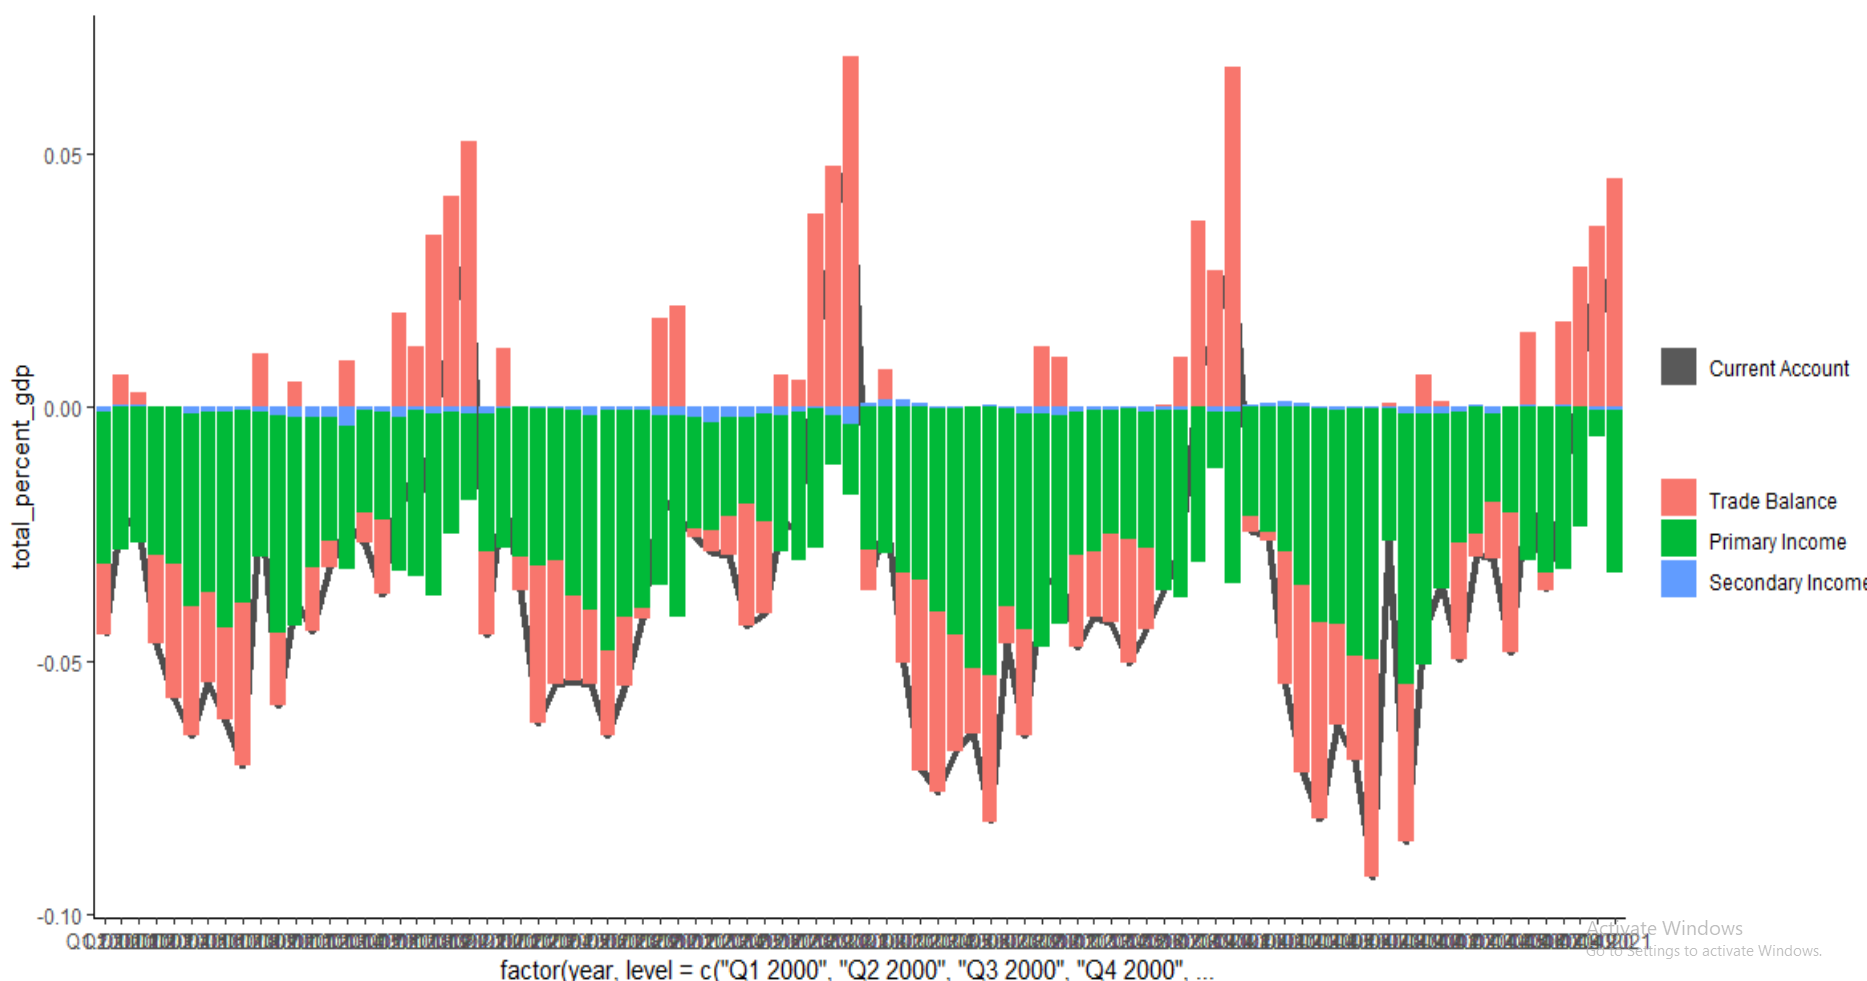
pl2 <- pl1 + geom_bar(stat = "identity", show.legend = TRUE)
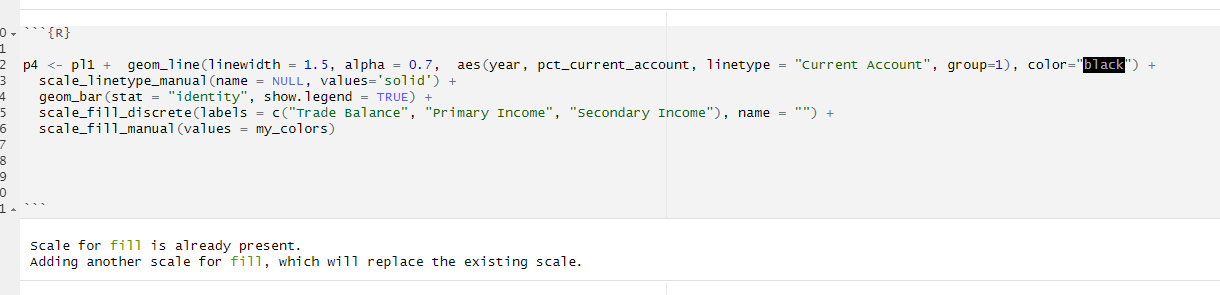
pl3 <- pl2 + geom_line(linewidth = 1.5, alpha = 0.7, aes(year, pct_current_account, linetype = "Current Account", group=1), color="black") +
scale_linetype_manual(name = NULL ,values='solid')
# make prettier
pl3 <- pl3 + labs(title = "Australia: Balance of Payments Decomposition")
pl3 <- pl3 + labs(subtitle = "(In Percent GDP)")
pl3 <- pl3 + labs(x = "Quarter", y = "Percentage of GDP")
pl3 <- pl3 + labs(fill = "Category")
pl3 <- pl3 + scale_fill_discrete(labels = c("Trade Balance", "Primary Income", "Secondary Income"), name = "")
pl3 <- pl3 + theme(legend.position="top")
pl3 <- pl3 + scale_y_continuous(labels = scales::percent_format(scale = 100))
pl3 <- pl3 + theme(axis.text.x = element_text(angle = -90, vjust = 0.5, hjust = 1))
pl3
The data is:
Show in New Window
structure(list(year = c("Q1 2000", "Q2 2000", "Q3 2000", "Q4 2000",
"Q1 2001", "Q2 2001", "Q3 2001", "Q4 2001", "Q1 2002", "Q2 2002",
"Q3 2002", "Q4 2002", "Q1 2003", "Q2 2003", "Q3 2003", "Q4 2003",
"Q1 2004", "Q2 2004", "Q3 2004", "Q4 2004", "Q1 2005", "Q2 2005",
"Q3 2005", "Q4 2005", "Q1 2006", "Q2 2006", "Q3 2006", "Q4 2006",
"Q1 2007", "Q2 2007", "Q3 2007", "Q4 2007", "Q1 2008", "Q2 2008",
"Q3 2008", "Q4 2008", "Q1 2009", "Q2 2009", "Q3 2009", "Q4 2009",
"Q1 2010", "Q2 2010", "Q3 2010", "Q4 2010", "Q1 2011", "Q2 2011",
"Q3 2011", "Q4 2011", "Q1 2012", "Q2 2012", "Q3 2012", "Q4 2012",
"Q1 2013", "Q2 2013", "Q3 2013", "Q4 2013", "Q1 2014", "Q2 2014",
"Q3 2014", "Q4 2014", "Q1 2015", "Q2 2015", "Q3 2015", "Q4 2015",
"Q1 2016", "Q2 2016", "Q3 2016", "Q4 2016", "Q1 2017", "Q2 2017",
"Q3 2017", "Q4 2017", "Q1 2018", "Q2 2018", "Q3 2018", "Q4 2018",
"Q1 2019", "Q2 2019", "Q3 2019", "Q4 2019", "Q1 2020", "Q2 2020",
"Q3 2020", "Q4 2020", "Q1 2021", "Q2 2021", "Q3 2021", "Q4 2021"
), current_account = c(-4665.61414587938, -4662.75400359808,
-3655.70777304411, -2503.19796891272, -2038.38904080495, -1546.31244230178,
-2006.63914906584, -2395.59783304185, -2315.38008534801, -3553.0943045394,
-4839.04541055744, -5294.7149557565, -5427.13925271129, -7277.15045968579,
-8279.37034404696, -8324.07164492358, -8822.38146136635, -8366.37730861287,
-11622.3876398519, -12475.8045003629, -11258.4205060203, -9393.20351044372,
-11790.7114534433, -10900.6078396563, -10142.2852474971, -10213.8221005907,
-11977.6238033478, -12984.861908247, -13179.6269125969, -13845.220853952,
-17378.4749184657, -19759.6851169096, -18605.1218230259, -14528.0734579645,
-12252.5438580804, -6735.92786313367, -4339.31098570835, -9635.95698870992,
-15018.7277936886, -19904.4119306574, -16882.6079479669, -4959.68879505347,
-10163.0810892132, -12708.8682599249, -13262.1216180016, -7480.17951828495,
-11534.9603693539, -12153.8945484751, -17039.3215728435, -9932.99712123018,
-18315.5901346881, -19195.0012034151, -12388.7819842456, -11229.0358493884,
-16288.3364552878, -11408.415898205, -8347.84306401588, -10642.3049479229,
-15520.1185421388, -10890.6083662856, -9050.13393815751, -14579.0378791409,
-17057.1926052596, -16272.3473719434, -11109.6252612271, -12256.9643409002,
-13204.936278482, -4614.36253494402, -4455.1352568022, -7348.54542911233,
-11857.9132459047, -11912.7579528318, -7613.73553354152, -8830.21810043089,
-9832.64200555172, -5335.38399407322, -1109.02667393265, 3660.72528764784,
2139.92399300987, 1486.36342433968, 5515.29390026161, 12065.5987721463,
5022.83386227289, 9913.46475323625, 13303.9556437895, 20134.6899303106,
12518.021780825, 4878.18344397281), balance_on_goods_and_services = c(-1456.26776128829,
-1707.61199752263, -806.127487569332, -308.708233461488, 580.879815222874,
1093.95835470305, 565.474712854233, -142.302606321717, 263.193798021211,
-637.197799572998, -1741.37710665181, -2603.83927276244, -2050.88486395599,
-3644.01214457502, -4413.77767248414, -4307.99685182095, -4079.05041543048,
-3720.93023255814, -5410.16506830373, -5978.55673844665, -4428.77825288582,
-2924.85744586017, -3977.33315102624, -3482.01359700555, -3299.92119702411,
-2756.01598536025, -2409.45311041244, -3815.72358537807, -3921.34772584363,
-3633.68510831549, -6174.5895042991, -9107.46542247905, -8396.8174376386,
-3626.35807613086, -1903.64634560704, 181.597655820871, 2473.25463277795,
-442.954175577192, -4856.42985182451, -7209.5293213748, -4161.90629552397,
5087.58402451866, 3421.09222205507, 1838.83073276714, 1753.95124564693,
6986.10516089823, 3450.93426176994, 372.192160592403, -4772.23369006031,
-704.159783716179, -7047.09387390109, -8919.01539082577, -1966.34149653574,
-1686.5823787887, -5124.00863287407, -1843.29736716772, 3347.74417366935,
-2788.62536068568, -6398.41816402276, -4062.70240633446, -2069.02862370137,
-8148.32256417047, -8247.81648390433, -9309.69836145661, -4400.02287792175,
-5511.75611119453, -4854.52184596201, 4378.17075748101, 6239.00809138502,
2086.28096086603, 142.875935129063, -1227.47754375588, 4243.21878092974,
1970.17899994179, 3498.08118933569, 5890.2409599576, 11801.8387671099,
13297.5303303175, 12799.1033701068, 9568.76352533526, 13843.5061283231,
15801.9999571294, 8970.41928486537, 11837.168974812, 20421.3013504932,
26861.9146673647, 26041.3654940305, 17482.4650165682), primary_income_net = c(-3132.93337543417,
-2826.55498864541, -2933.98252242114, -2237.07018144592, -2656.43666870205,
-2618.73012616679, -2715.92214493478, -2345.43360491405, -2623.64841177049,
-2928.57431585756, -3241.73316047985, -2800.7870471968, -3409.44790100429,
-3628.66085591962, -3961.67311590197, -4099.07224116961, -4749.45344806033,
-4592.57671560747, -6187.40204757505, -6484.39390273409, -6619.85802010301,
-6361.52652044941, -7793.62836698419, -7323.33019120318, -6669.34555168216,
-7148.18331232717, -9590.87995882051, -9140.63402796502, -9104.22343324248,
-10086.923773472, -11315.7040195401, -10645.1010111497, -10080.5306687127,
-10767.7552239744, -10269.3181208534, -6875.82531650679, -6647.32805380647,
-9033.23643527497, -9908.44856657597, -12444.8043343863, -12293.2137745314,
-9624.77754430437, -13221.302843388, -14153.6638356705, -14336.9943744977,
-13903.1461643123, -14476.7059736981, -12062.8692918085, -11517.0750283109,
-8544.88299952857, -10864.5293411072, -9884.27229880307, -9699.85670651187,
-8365.60696333455, -10983.8146427506, -9799.70315573218, -10404.5450282359,
-7153.95759977844, -8929.29456951159, -6413.08266162016, -6743.79173893095,
-5819.00743192957, -8745.52954758822, -7041.86822761064, -6434.96137470633,
-6367.11861417655, -8116.14186491072, -9108.00482807361, -10092.4462238632,
-8856.55556929195, -11879.2262307029, -10763.6791000359, -11625.01999163,
-10470.2671833955, -13191.8234193443, -11395.0250108856, -12437.196373499,
-9557.66558265353, -10657.1230760146, -8174.65714112701, -8008.42782869053,
-3165.25246049728, -3695.7640980632, -1692.2756681642, -6611.77993151259,
-5409.35417086459, -13224.9806250867, -12351.4089022849), secondary_income_net = c(-76.4130091569309,
-128.587017430029, 84.4022369463615, 42.580445994688, 37.1678126742241,
-21.5406708380347, 143.808283014701, 92.1383781939173, 45.0745284012703,
12.6778108911583, 144.064856574214, 109.911364202743, 33.1935122489987,
-4.47745919115765, 96.0804443391508, 82.9974480669706, 6.12240212447352,
-52.8703604472547, -24.8205239730804, -12.8538591821921, -209.784233031433,
-106.819544134147, -19.7499354329034, -95.2640514475883, -173.018498790867,
-309.622802903223, 22.7092658851314, -28.5042949038943, -154.055753510794,
-124.611972164454, 111.818605373506, -7.1186832808825, -127.773716674621,
-133.960157859153, -79.5793916200218, -41.7002024477571, -165.237564679826,
-159.766377857755, -253.849375288171, -250.078274896326, -427.487877911583,
-422.49527526776, -362.870467880248, -394.035157021529, -679.078489150817,
-563.138514870884, -509.188657425743, -463.217417259018, -750.012854472343,
-683.954337985438, -403.966919679859, -391.713513786267, -722.58378119793,
-1176.84650726512, -180.513179663125, 234.584624694885, -1291.04220944935,
-699.721987458768, -192.405808604414, -414.823298330992, -237.313575525186,
-611.707883040878, -63.8465737670286, 79.2192171238669, -274.641008598982,
-378.089615529107, -234.272567609287, 115.471535648583, -601.697124324026,
-578.270820686407, -122.352320138146, 78.3986909599874, -232.720540884788,
-330.12991697718, -138.89977554311, 168.68226000366, -473.669067543489,
-79.1394600161097, -2.05630108232852, 92.2570401314284, -319.784399370931,
-571.148724485837, -251.821324529277, -231.428553411583, -505.565775191071,
-1317.87056618956, -298.36308811876, -252.872670310512), nominal_gdp = c(103962.82107643,
103962.82107643, 103962.82107643, 103962.82107643, 94839.5406246646,
94839.5406246646, 94839.5406246646, 94839.5406246646, 98895.1967350356,
98895.1967350356, 98895.1967350356, 98895.1967350356, 116874.490390215,
116874.490390215, 116874.490390215, 116874.490390215, 153581.590553422,
153581.590553422, 153581.590553422, 153581.590553422, 173832.130506691,
173832.130506691, 173832.130506691, 173832.130506691, 186976.639712489,
186976.639712489, 186976.639712489, 186976.639712489, 213606.814791552,
213606.814791552, 213606.814791552, 213606.814791552, 263910.698299015,
263910.698299015, 263910.698299015, 263910.698299015, 232156.714769548,
232156.714769548, 232156.714769548, 232156.714769548, 287152.51475381,
287152.51475381, 287152.51475381, 287152.51475381, 349601.449275362,
349601.449275362, 349601.449275362, 349601.449275362, 386723.035677459,
386723.035677459, 386723.035677459, 386723.035677459, 394095.106186519,
394095.106186519, 394095.106186519, 394095.106186519, 366886.303130451,
366886.303130451, 366886.303130451, 366886.303130451, 337653.922955321,
337653.922955321, 337653.922955321, 337653.922955321, 301633.789489009,
301633.789489009, 301633.789489009, 301633.789489009, 331629.082132891,
331629.082132891, 331629.082132891, 331629.082132891, 357072.126191768,
357072.126191768, 357072.126191768, 357072.126191768, 348056.96609927,
348056.96609927, 348056.96609927, 348056.96609927, 331725.264780802,
331725.264780802, 331725.264780802, 331725.264780802, 388166.840809015,
388166.840809015, 388166.840809015, 388166.840809015)), row.names = c(NA,
-88L), class = c("tbl_df", "tbl", "data.frame"))
Any help would be super appreciated!