Thank you for the reply. Thanks for the reminder about scaling to the output device. However, I feel like I am still not understanding the relationships between size= and linewidth= in points, lines, and text. I thought my lack of understanding was related only to linewidth=, but it seems like it may be a larger misunderstanding. I will try to ask and demonstrate my question in a different way.
In this tidyverse documentation about aesthetic specifications the following statements are made:
- re: lines (under "Linewidth" subheading.
Due to a historical error, the unit of linewidth is roughly 0.75 mm. Making it exactly 1 mm
would change a very large number of existing plots, so we’re stuck with this mistake.
- re: points (under "Colour and Fill" subheading)
The size of the filled part is controlled by size, the size of the stroke is controlled by
stroke. Each is measured in mm, and the total size of the point is the sum of the two.
- re: text (under "Font size" subheading)
The size of text is measured in mm. This is unusual, but makes the size of text consistent
with the size of lines and points.
Given these it seems that all three are measured in mm. [Side note: except when size= is used in element_text() where the units are pts.] My interpretation of this language though is that for the same size= and linewidth= that text and points (size=+stroke=) should be the same size, but lines will be smaller due to the "historical error."
However, my experiment below does not support this.
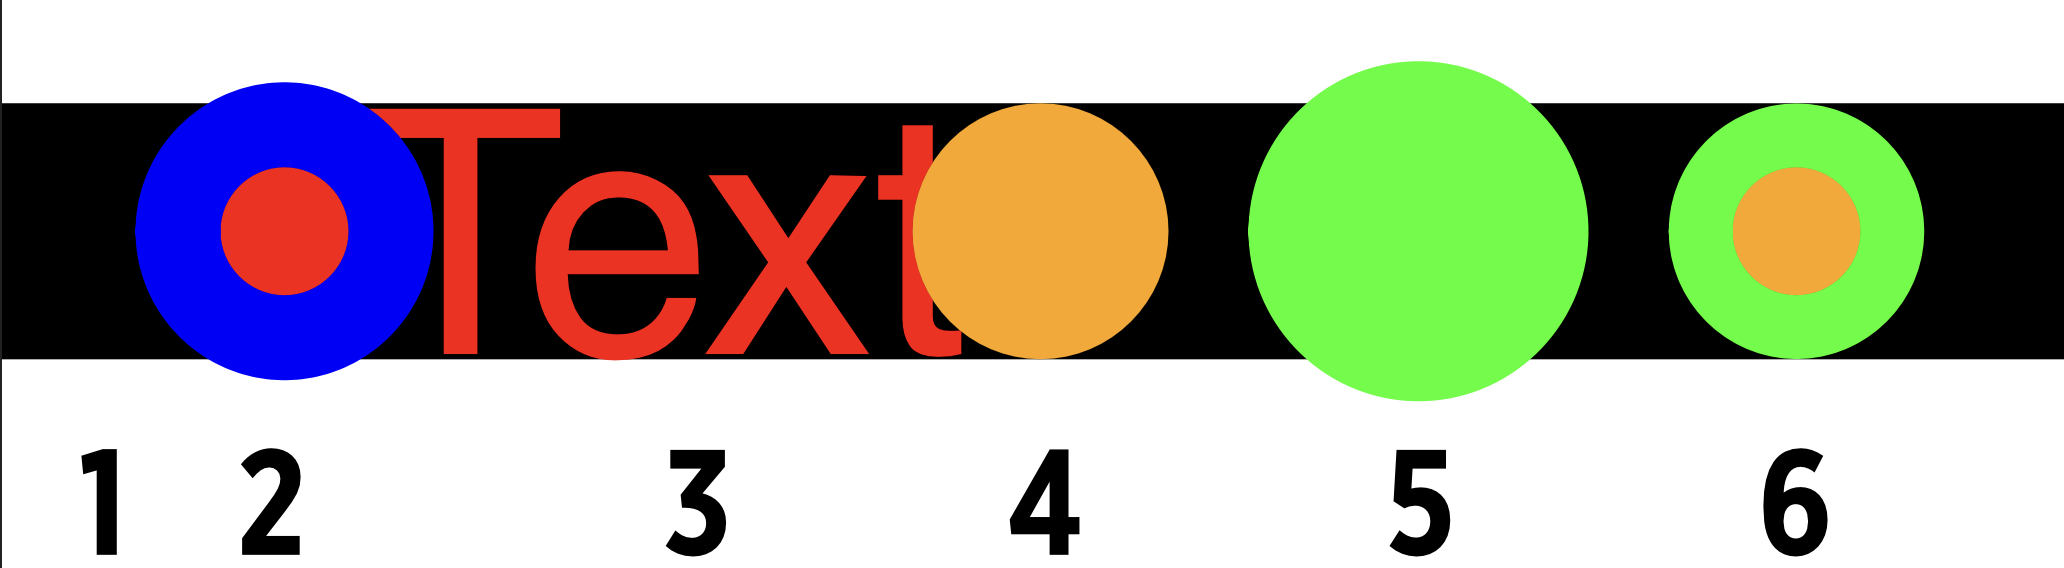
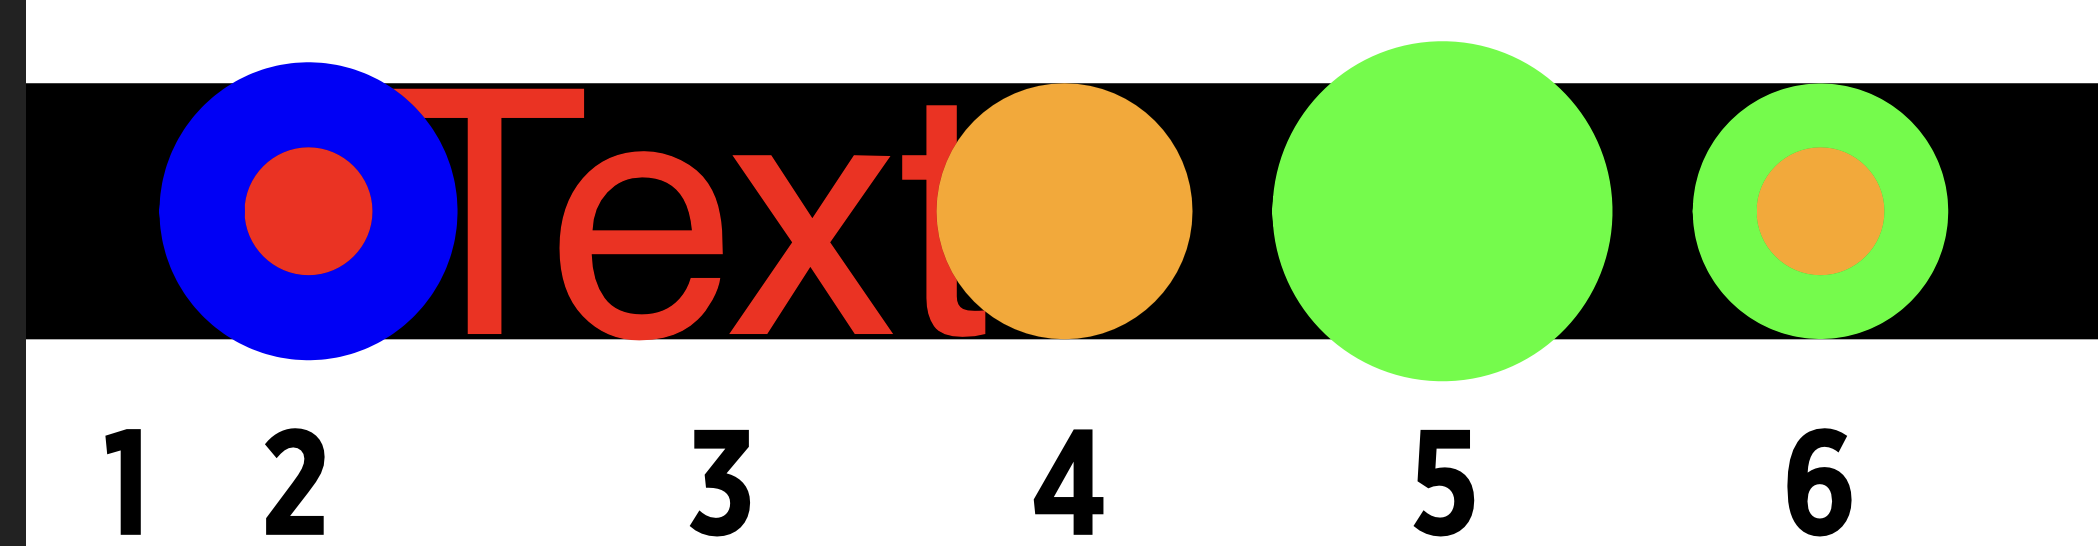
ggplot() +
geom_hline(yintercept=1,linewidth=20) +
geom_text(data=data.frame(x=0.5,y=1,label="Text"),
mapping=aes(x=x,y=y,label=label),
size=20,color="red") +
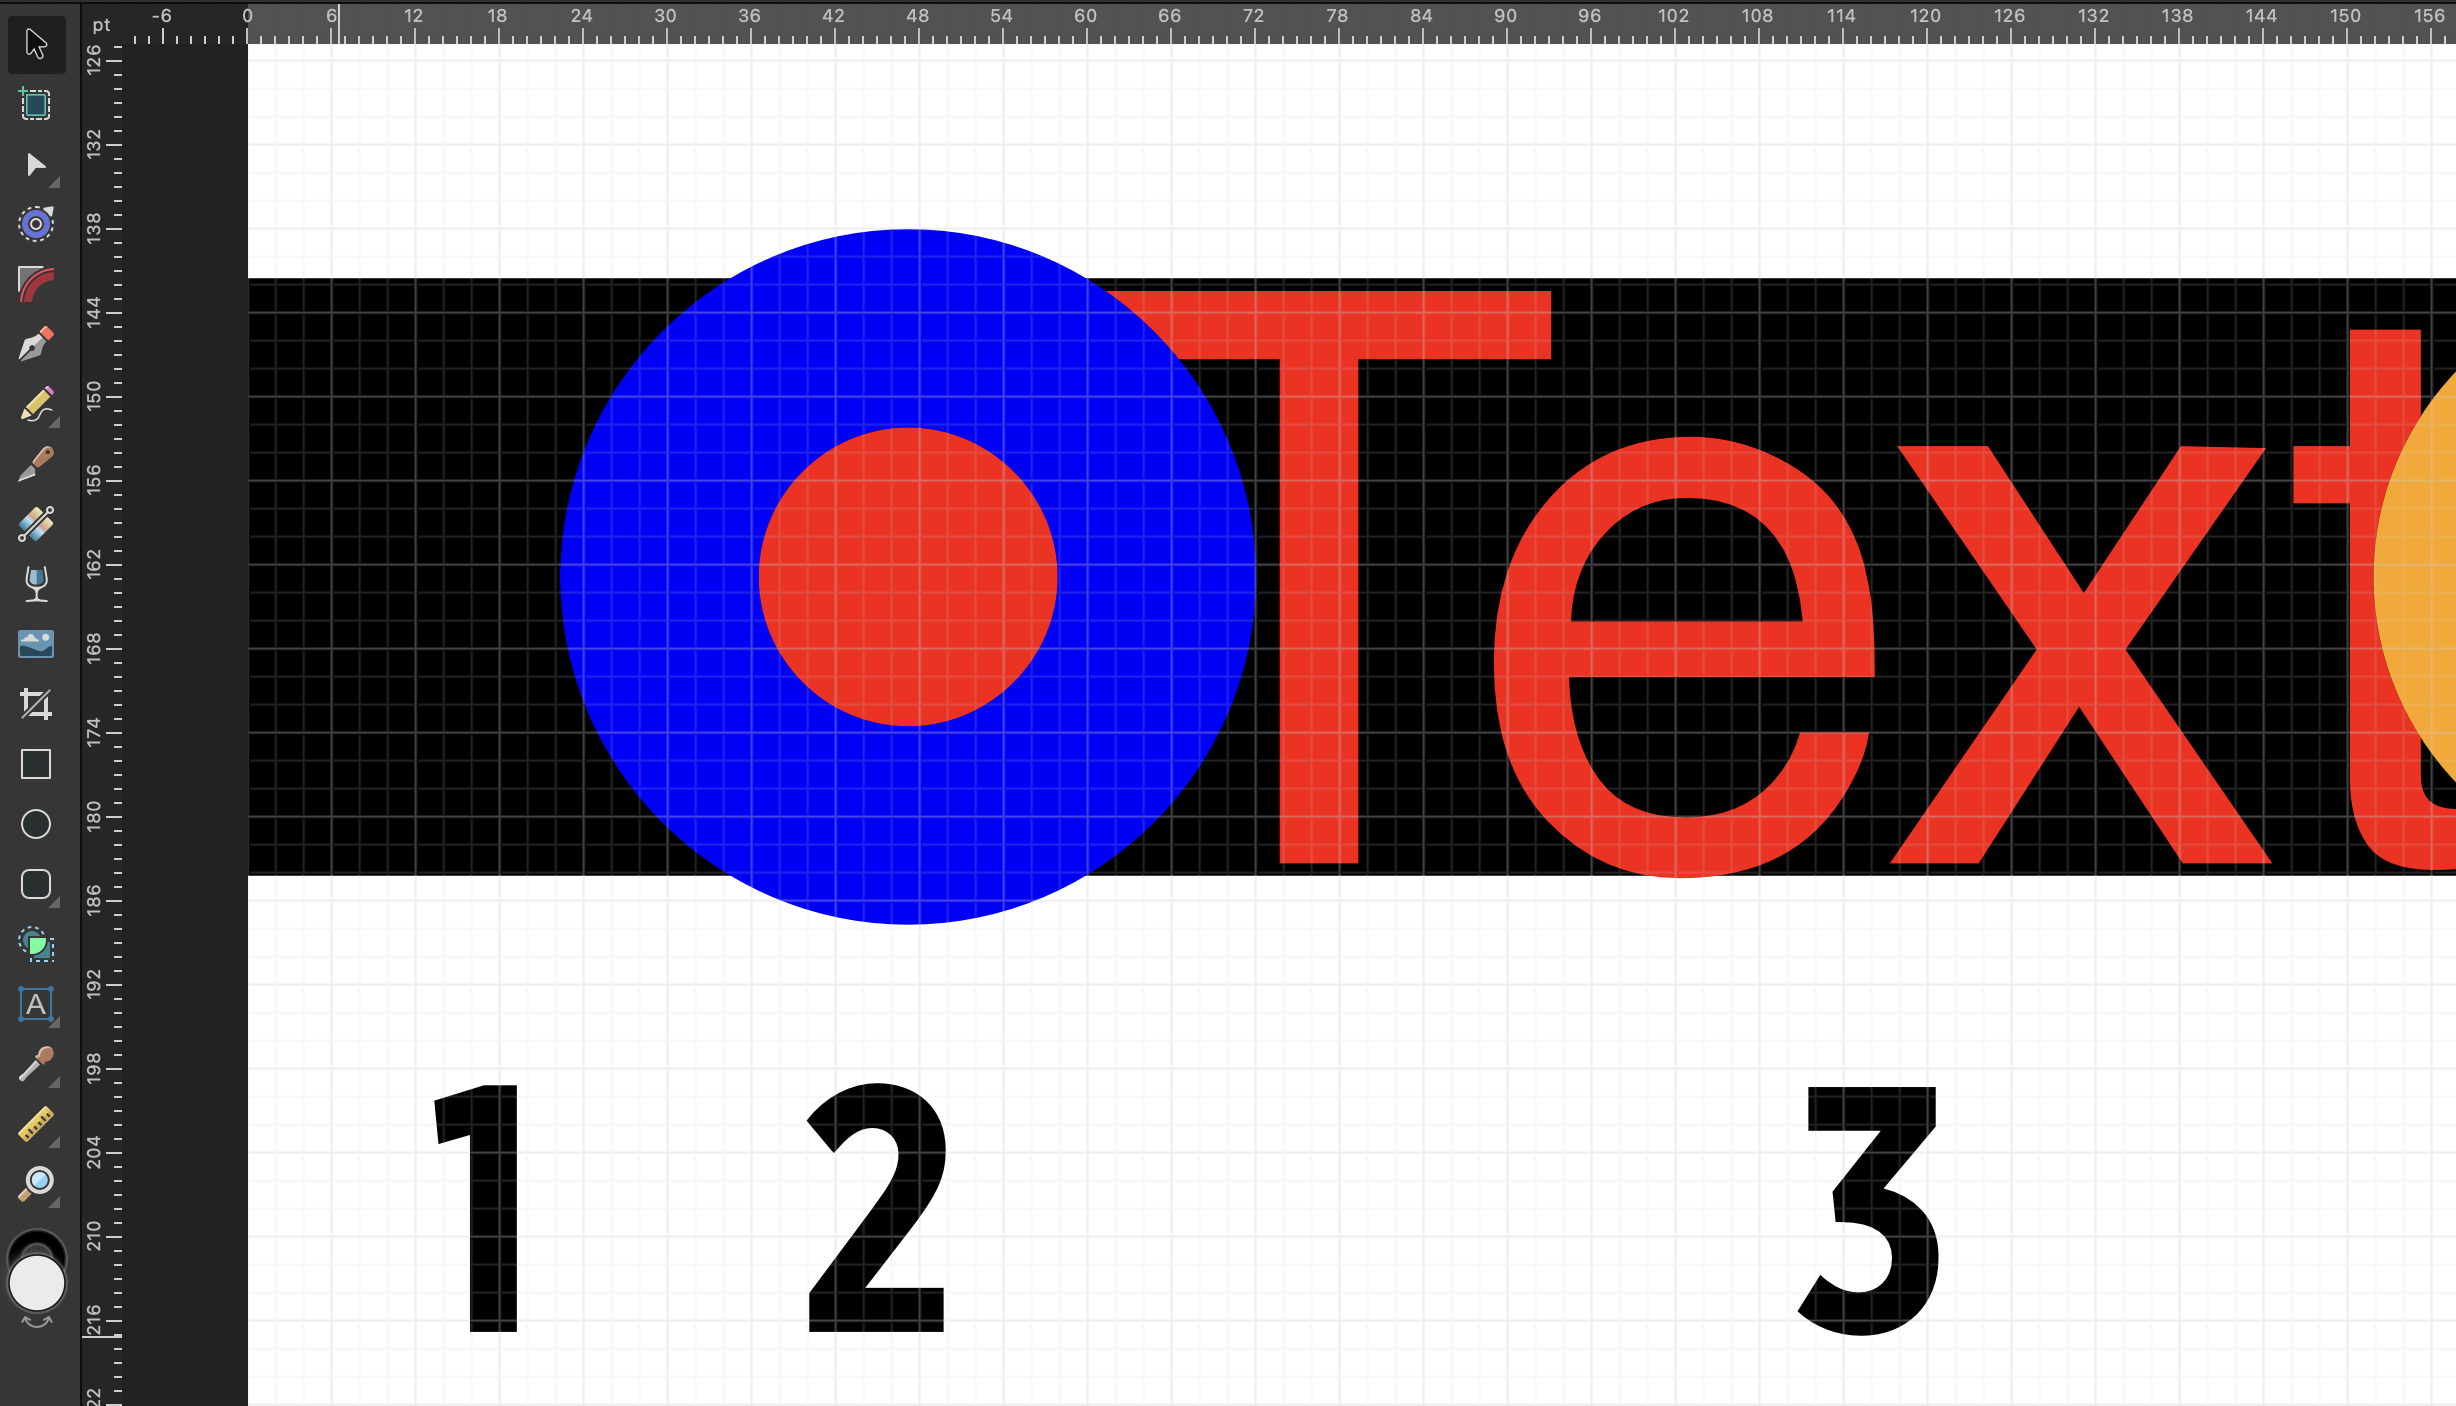
geom_point(data=data.frame(x=0.4,y=1),mapping=aes(x=x,y=y),
pch=21,size=10,stroke=10,fill="red",color="blue") +
geom_point(data=data.frame(x=0.6,y=1),mapping=aes(x=x,y=y),
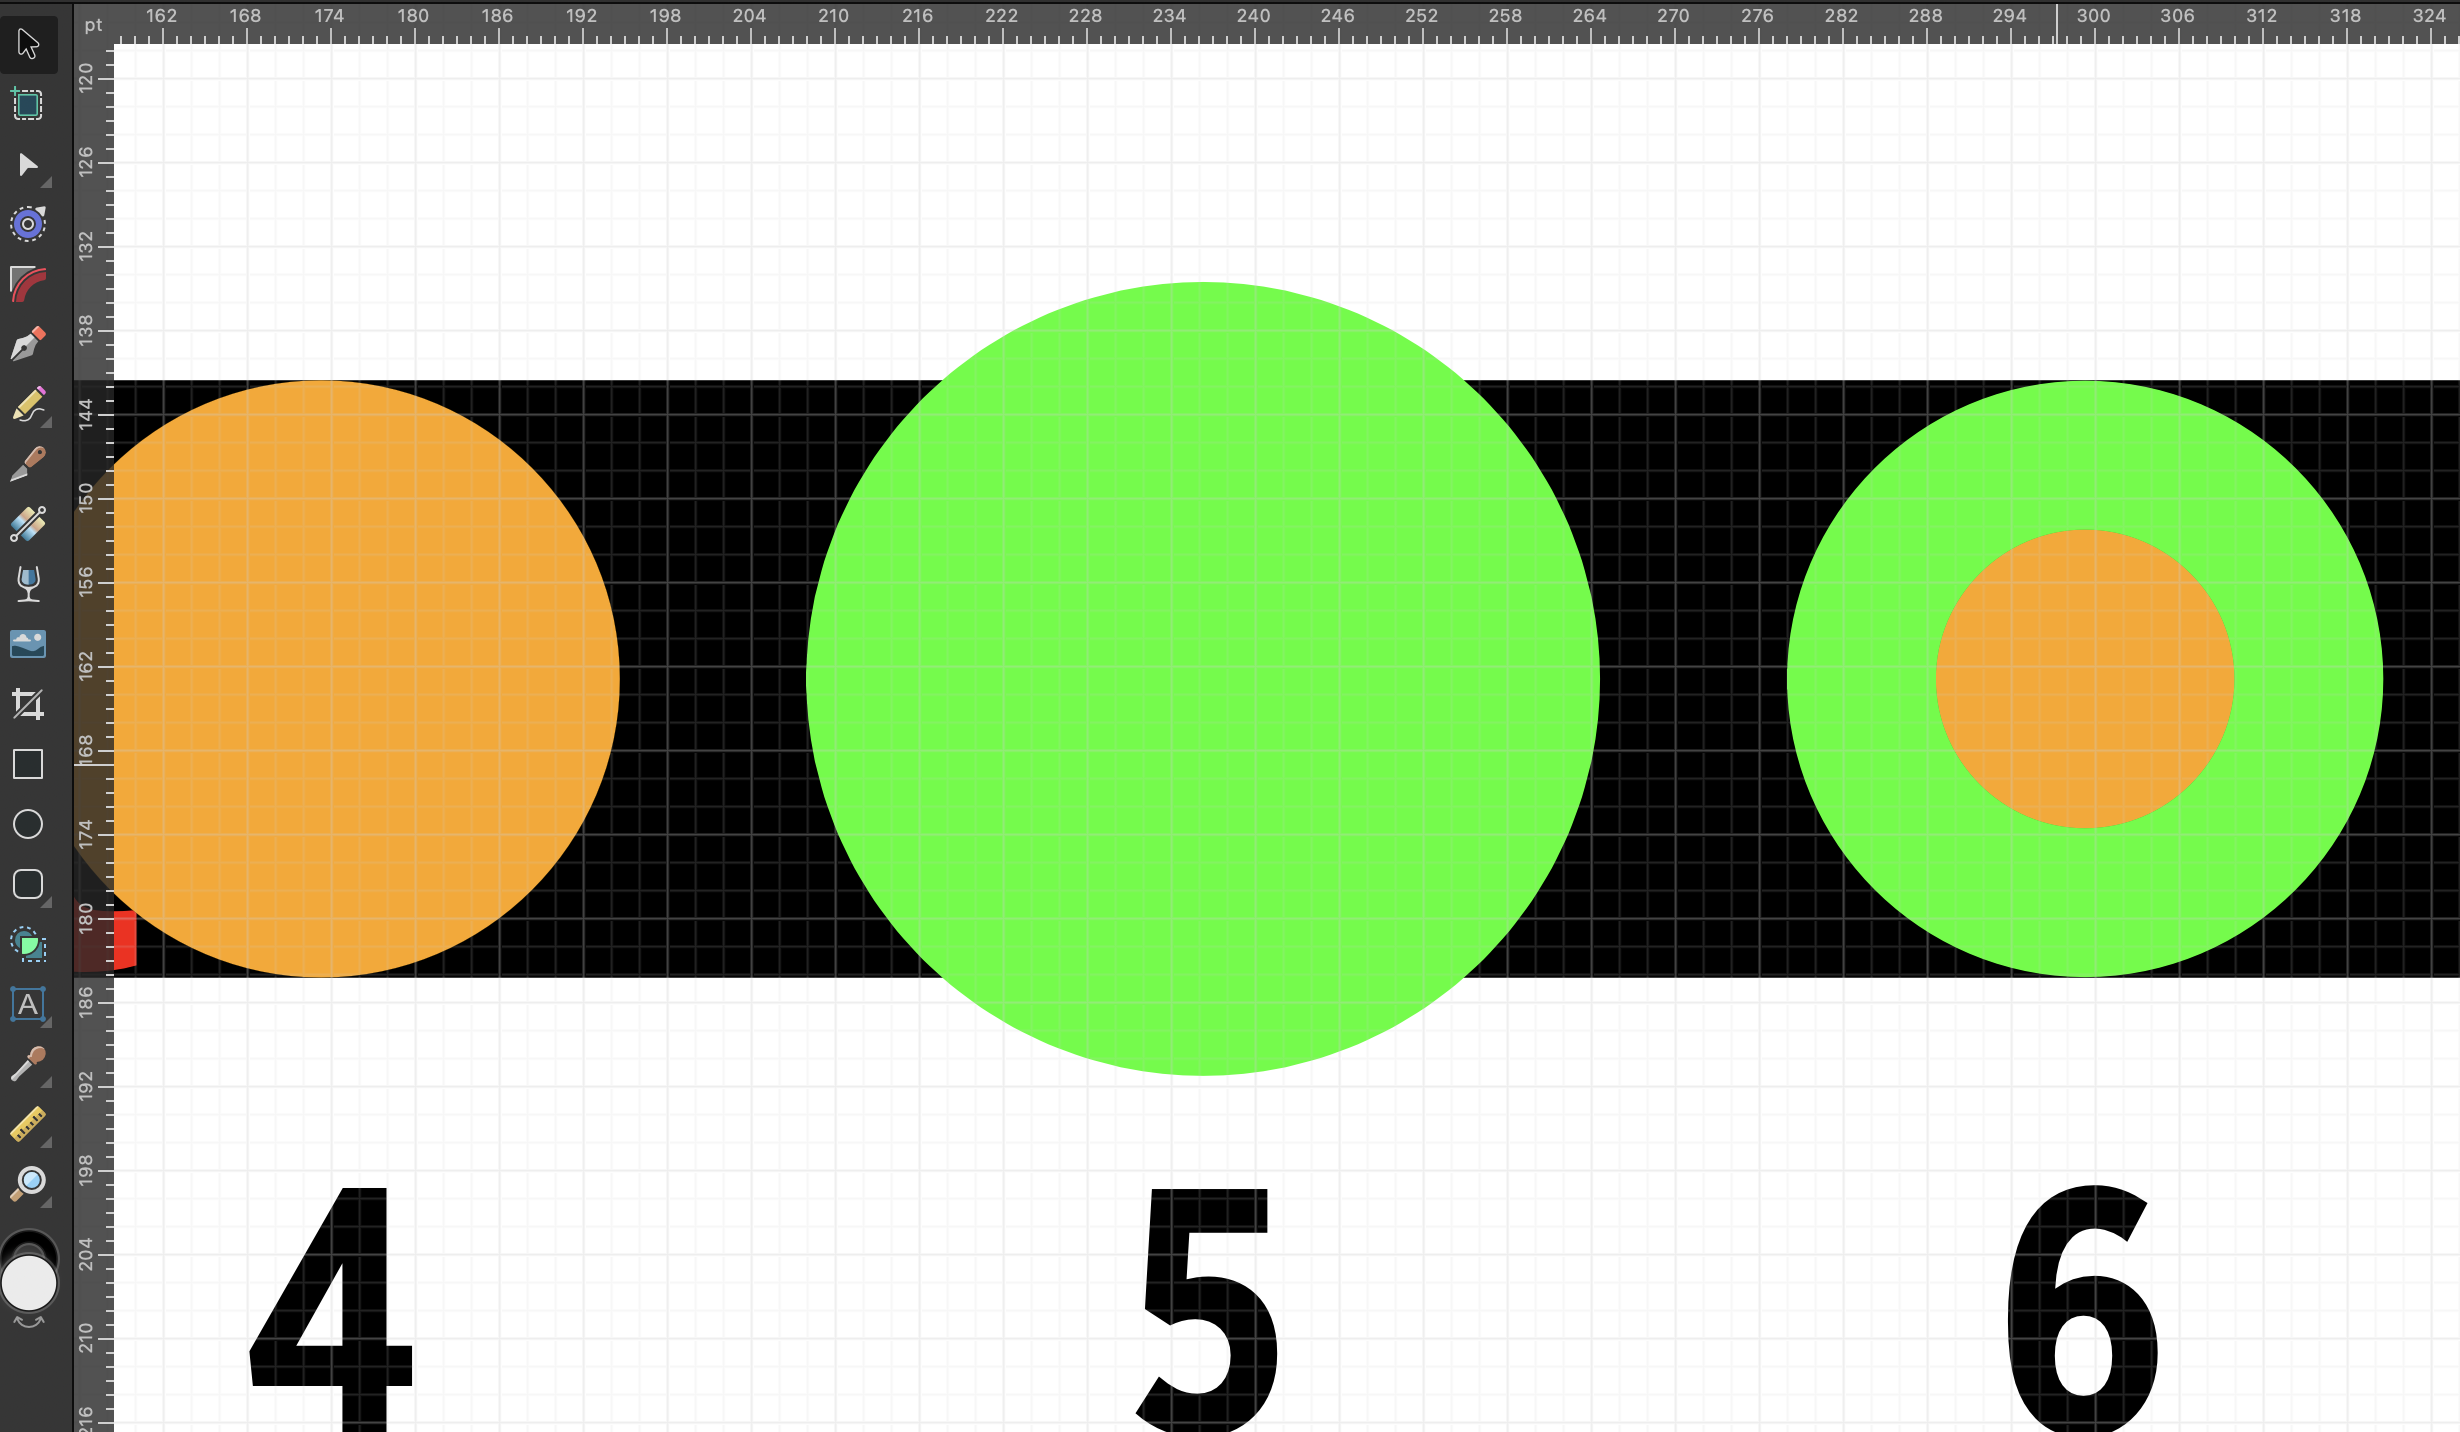
pch=21,size=20,stroke=0,fill="orange") +
geom_point(data=data.frame(x=0.7,y=1),mapping=aes(x=x,y=y),
pch=21,size=0,stroke=20,color="green") +
geom_point(data=data.frame(x=0.8,y=1),mapping=aes(x=x,y=y),
pch=21,size=10,stroke=10*0.75,fill="orange",color="green") +
scale_x_continuous(limit=c(0.35,0.85)) +
theme_void()

It seems that ...
- My text and line are the same height ... I expected the line to be smaller.
- My blue and red point is larger than the line and the text ... I expected it to be the same as the text.
- My orange point (just
size=) and green point (just stroke=) are note the same size ... I expected them to be equal given that size=+stroke= gives the "size" of the point.
- My orange and green point equals the orange point (not sure any more what I expected here).
Thoughts on what I am missing here? Thanks.