Hi, I was trying to use ggpairs() to compare my covariates, but I don't why it is giving me all NA.
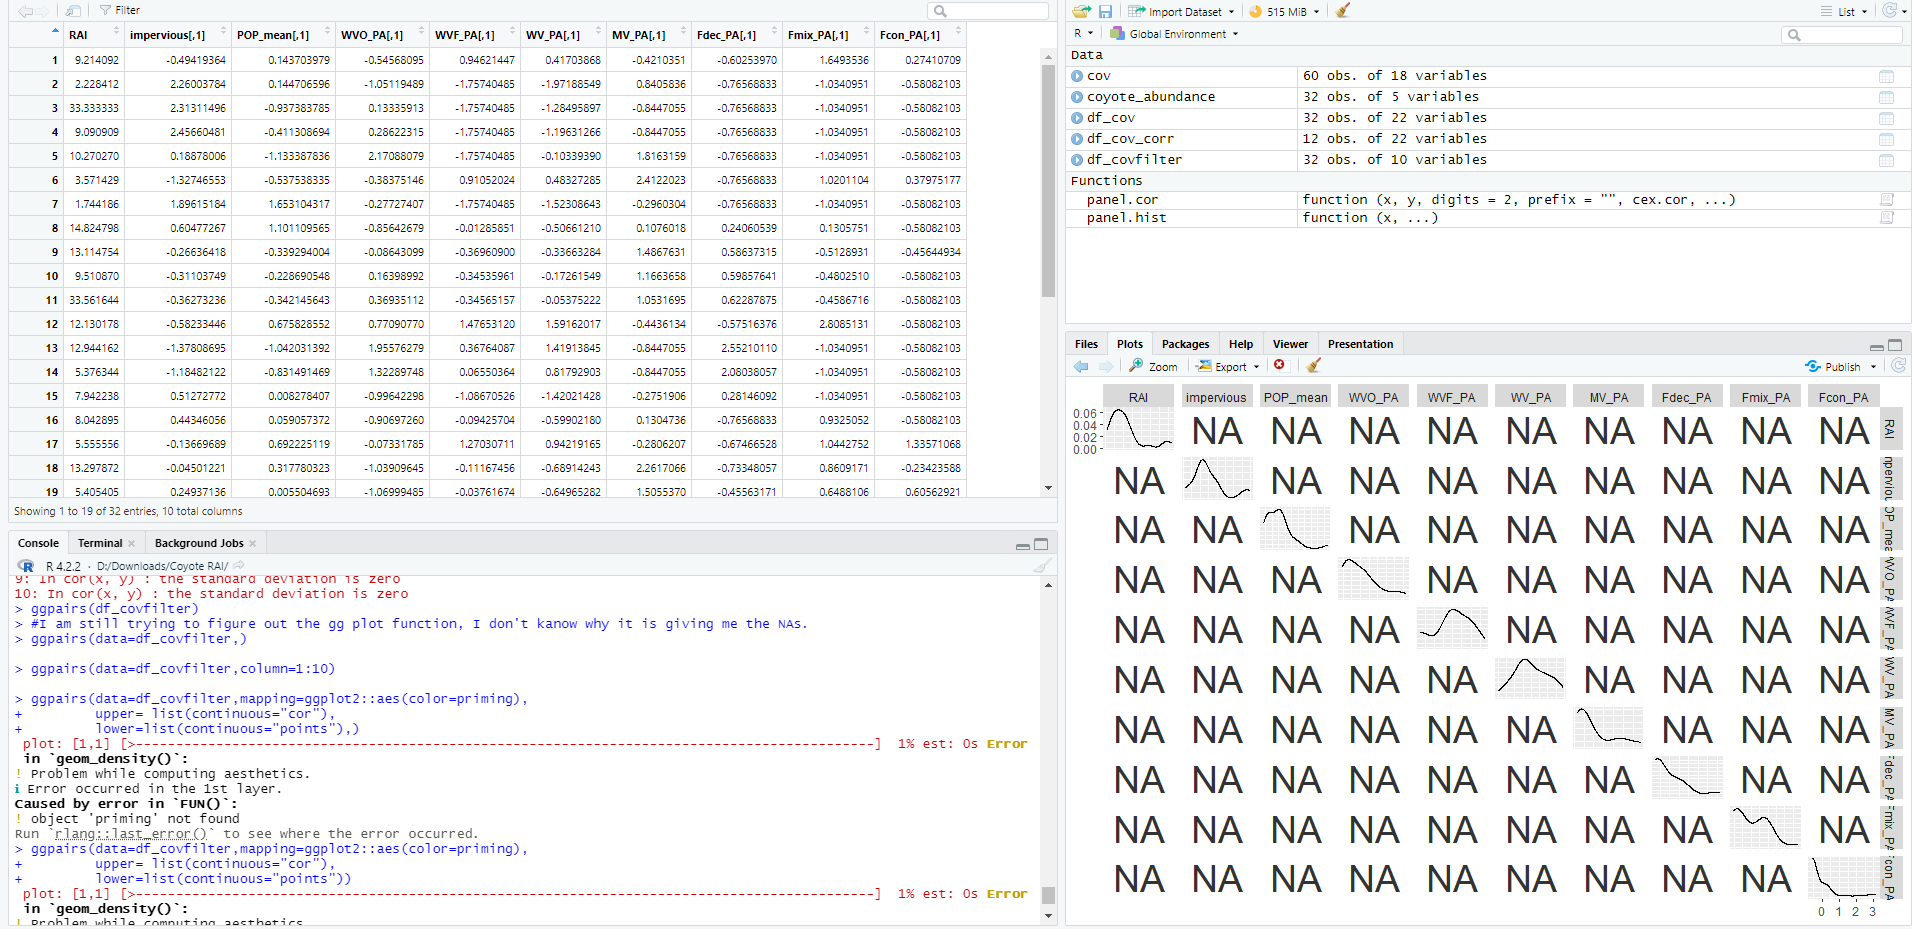
The table that I had has no NA
Hi, I was trying to use ggpairs() to compare my covariates, but I don't why it is giving me all NA.
The table that I had has no NA
Please post a sample of your data by posting the output of
dput(head(df_covfilter,20))
Put a line with three back ticks before and after the output, like this
```
output of dput()
```
Hi, I am sorry! I am new to R so I don't we could do that! here is my output:
df_covfilter <- structure(list(RAI = c(9.21409214092141, 2.22841225626741, 33.3333333333333,
9.09090909090909, 10.2702702702703, 3.57142857142857, 1.74418604651163,
14.8247978436658, 13.1147540983607, 9.51086956521739, 33.5616438356164,
12.1301775147929, 12.9441624365482, 5.37634408602151, 7.94223826714801,
8.04289544235925, 5.55555555555556, 13.2978723404255, 5.40540540540541,
7.71604938271605), impervious = structure(c(-0.49419364393212,
2.2600378400381, 2.31311496478057, 2.45660480637555, 0.188780063569382,
-1.3274655345595, 1.89615183674753, 0.604772672075346, -0.266364184949559,
-0.311037492877982, -0.362732362536432, -0.582334462800772, -1.37808695080163,
-1.18482122134038, 0.512727717836385, 0.443460562801218, -0.136696894194842,
-0.0450122085682065, 0.249371362226086, 0.162259882249793), dim = c(20L,
1L)), POP_mean = structure(c(0.143703978884707, 0.144706596438163,
-0.937383784889262, -0.411308694045212, -1.13338783647516, -0.537538335295104,
1.65310431691116, 1.10110956463149, -0.339294003843363, -0.228690547961975,
-0.342145643468827, 0.675828551988144, -1.04203139152471, -0.831491469056029,
0.00827840689366452, 0.0590573716173202, 0.692225119000071, 0.317780323486665,
0.00550469336840367, 0.320180063897847), dim = c(20L, 1L)), WVO_PA = structure(c(-0.545680952559884,
-1.05119488686581, 0.133359128115711, 0.286223152057478, 2.17088079292038,
-0.383751464217749, -0.277274072386111, -0.856426785166869, -0.0864309934041775,
0.163989916194202, 0.369351118975989, 0.770907704444724, 1.95576278650966,
1.32289747592253, -0.996422978951162, -0.906972603281102, -0.0733178493268912,
-1.03909645036594, -1.06999485362968, -0.539659610891743), dim = c(20L,
1L)), WVF_PA = structure(c(0.946214472331713, -1.75740485484269,
-1.75740485484269, -1.75740485484269, -1.75740485484269, 0.910520237382316,
-1.75740485484269, -0.0128585061298562, -0.36960899598283, -0.345359605705218,
-0.345651566028478, 1.47653120350091, 0.367640870589426, 0.0655036446330881,
-1.08670525852663, -0.0942570442547027, 1.27030711459719, -0.111674562968033,
-0.0376167415422916, 1.01010373278449), dim = c(20L, 1L)), WV_PA = structure(c(0.417038682642984,
-1.97188548848718, -1.28495897330757, -1.19631265584581, -0.103393895560527,
0.483272852149204, -1.52308642876359, -0.5066121038881, -0.33663283865233,
-0.172615489289325, -0.0537522164333919, 1.59162017129829, 1.41913845330464,
0.817929027939976, -1.42021428167051, -0.599021799915961, 0.942191649769618,
-0.689142430630418, -0.649652820831093, 0.470055763164462), dim = c(20L,
1L)), MV_PA = structure(c(-0.421035110750841, 0.840583581874058,
-0.84470553189996, -0.84470553189996, 1.81631590009036, 2.4122022682306,
-0.296030379119724, 0.107601804998308, 1.48676310267542, 1.16636580398286,
1.05316952076556, -0.443613405997137, -0.84470553189996, -0.84470553189996,
-0.275190612607392, 0.130473618082806, -0.280620692614127, 2.26170664126642,
1.50553695517272, -0.483938241307021), dim = c(20L, 1L)), Fdec_PA = structure(c(-0.602539704382623,
-0.765688325567961, -0.765688325567961, -0.765688325567961, -0.765688325567961,
-0.765688325567961, -0.765688325567961, 0.240605389168713, 0.586373150312604,
0.598576411911603, 0.622878745042588, -0.57516376427473, 2.55210109714646,
2.08038056874119, 0.281460919196525, -0.765688325567961, -0.674665278272972,
-0.733480571102299, -0.455631709893072, 0.0836821244874533), dim = c(20L,
1L)), Fmix_PA = structure(c(1.64935364329639, -1.03409513034798,
-1.03409513034798, -1.03409513034798, -1.03409513034798, 1.02011035825213,
-1.03409513034798, 0.130575076071418, -0.512893109963956, -0.480251030861249,
-0.45867161914772, 2.80851311689156, -1.03409513034798, -1.03409513034798,
-1.03409513034798, 0.932505156999831, 1.0442751791972, 0.860917132460919,
0.64881057112203, 1.05475072178081), dim = c(20L, 1L)), Fcon_PA = structure(c(0.274107085561191,
-0.580821027580448, -0.580821027580448, -0.580821027580448, -0.580821027580448,
0.379751773827979, -0.580821027580448, -0.580821027580448, -0.456449342549605,
-0.580821027580448, -0.580821027580448, -0.580821027580448, -0.580821027580448,
-0.580821027580448, -0.580821027580448, -0.580821027580448, 1.33571067748294,
-0.234235884570329, 0.605629209435004, -0.152882010946772), dim = c(20L,
1L))), row.names = c(NA, 20L), class = "data.frame")
Most of the columns in your data frame are themselves data frames. How did you make your data frame? This code seems to fix the problem.
df_covfilter <- structure(list(RAI = c(9.21409214092141, 2.22841225626741, 33.3333333333333,
9.09090909090909, 10.2702702702703, 3.57142857142857, 1.74418604651163,
14.8247978436658, 13.1147540983607, 9.51086956521739, 33.5616438356164,
12.1301775147929, 12.9441624365482, 5.37634408602151, 7.94223826714801,
8.04289544235925, 5.55555555555556, 13.2978723404255, 5.40540540540541,
7.71604938271605),
impervious = structure(c(-0.49419364393212,
2.2600378400381, 2.31311496478057, 2.45660480637555, 0.188780063569382,
-1.3274655345595, 1.89615183674753, 0.604772672075346, -0.266364184949559,
-0.311037492877982, -0.362732362536432, -0.582334462800772, -1.37808695080163,
-1.18482122134038, 0.512727717836385, 0.443460562801218, -0.136696894194842,
-0.0450122085682065, 0.249371362226086, 0.162259882249793), dim = c(20L,
1L)),
POP_mean = structure(c(0.143703978884707, 0.144706596438163,
-0.937383784889262, -0.411308694045212, -1.13338783647516, -0.537538335295104,
1.65310431691116, 1.10110956463149, -0.339294003843363, -0.228690547961975,
-0.342145643468827, 0.675828551988144, -1.04203139152471, -0.831491469056029,
0.00827840689366452, 0.0590573716173202, 0.692225119000071, 0.317780323486665,
0.00550469336840367, 0.320180063897847), dim = c(20L, 1L)),
WVO_PA = structure(c(-0.545680952559884,
-1.05119488686581, 0.133359128115711, 0.286223152057478, 2.17088079292038,
-0.383751464217749, -0.277274072386111, -0.856426785166869, -0.0864309934041775,
0.163989916194202, 0.369351118975989, 0.770907704444724, 1.95576278650966,
1.32289747592253, -0.996422978951162, -0.906972603281102, -0.0733178493268912,
-1.03909645036594, -1.06999485362968, -0.539659610891743), dim = c(20L,
1L)),
WVF_PA = structure(c(0.946214472331713, -1.75740485484269,
-1.75740485484269, -1.75740485484269, -1.75740485484269, 0.910520237382316,
-1.75740485484269, -0.0128585061298562, -0.36960899598283, -0.345359605705218,
-0.345651566028478, 1.47653120350091, 0.367640870589426, 0.0655036446330881,
-1.08670525852663, -0.0942570442547027, 1.27030711459719, -0.111674562968033,
-0.0376167415422916, 1.01010373278449), dim = c(20L, 1L)),
WV_PA = structure(c(0.417038682642984,
-1.97188548848718, -1.28495897330757, -1.19631265584581, -0.103393895560527,
0.483272852149204, -1.52308642876359, -0.5066121038881, -0.33663283865233,
-0.172615489289325, -0.0537522164333919, 1.59162017129829, 1.41913845330464,
0.817929027939976, -1.42021428167051, -0.599021799915961, 0.942191649769618,
-0.689142430630418, -0.649652820831093, 0.470055763164462), dim = c(20L,
1L)),
MV_PA = structure(c(-0.421035110750841, 0.840583581874058,
-0.84470553189996, -0.84470553189996, 1.81631590009036, 2.4122022682306,
-0.296030379119724, 0.107601804998308, 1.48676310267542, 1.16636580398286,
1.05316952076556, -0.443613405997137, -0.84470553189996, -0.84470553189996,
-0.275190612607392, 0.130473618082806, -0.280620692614127, 2.26170664126642,
1.50553695517272, -0.483938241307021), dim = c(20L, 1L)),
Fdec_PA = structure(c(-0.602539704382623,
-0.765688325567961, -0.765688325567961, -0.765688325567961, -0.765688325567961,
-0.765688325567961, -0.765688325567961, 0.240605389168713, 0.586373150312604,
0.598576411911603, 0.622878745042588, -0.57516376427473, 2.55210109714646,
2.08038056874119, 0.281460919196525, -0.765688325567961, -0.674665278272972,
-0.733480571102299, -0.455631709893072, 0.0836821244874533), dim = c(20L,
1L)),
Fmix_PA = structure(c(1.64935364329639, -1.03409513034798,
-1.03409513034798, -1.03409513034798, -1.03409513034798, 1.02011035825213,
-1.03409513034798, 0.130575076071418, -0.512893109963956, -0.480251030861249,
-0.45867161914772, 2.80851311689156, -1.03409513034798, -1.03409513034798,
-1.03409513034798, 0.932505156999831, 1.0442751791972, 0.860917132460919,
0.64881057112203, 1.05475072178081), dim = c(20L, 1L)),
Fcon_PA = structure(c(0.274107085561191,
-0.580821027580448, -0.580821027580448, -0.580821027580448, -0.580821027580448,
0.379751773827979, -0.580821027580448, -0.580821027580448, -0.456449342549605,
-0.580821027580448, -0.580821027580448, -0.580821027580448, -0.580821027580448,
-0.580821027580448, -0.580821027580448, -0.580821027580448, 1.33571067748294,
-0.234235884570329, 0.605629209435004, -0.152882010946772), dim = c(20L,
1L))), row.names = c(NA, 20L), class = "data.frame")
library(GGally)
#> Loading required package: ggplot2
#> Registered S3 method overwritten by 'GGally':
#> method from
#> +.gg ggplot2
library(dplyr)
#>
#> Attaching package: 'dplyr'
#> The following objects are masked from 'package:stats':
#>
#> filter, lag
#> The following objects are masked from 'package:base':
#>
#> intersect, setdiff, setequal, union
Col1 <- function(df) return(df[,1])
tmp <- df_covfilter |> mutate(across(2:10, Col1))
ggpairs(tmp)
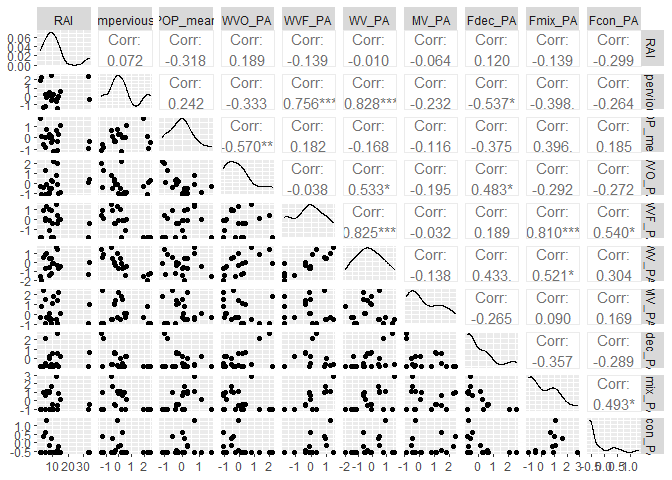
Created on 2023-02-07 with reprex v2.0.2
Opps that is so weird! Thank you for troubleshooting and I will do it with the dput() function
This topic was automatically closed 7 days after the last reply. New replies are no longer allowed.
If you have a query related to it or one of the replies, start a new topic and refer back with a link.