Why are all of my students histograms being labeled as "Count" on the vertical axis of a histograms, except for 1 student who is is getting "Density"?
One possible cause is that uneven breaks result in a density plot in the hist() function.
set.seed(123)
VEC <- rnorm(100)
hist(VEC, breaks = seq(-3,3,0.5))
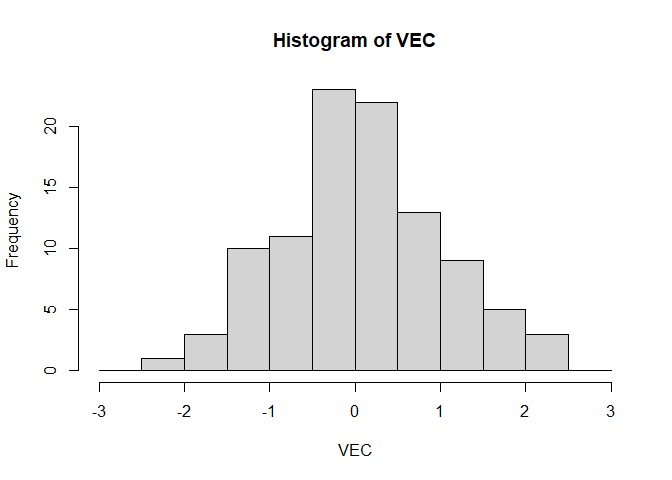
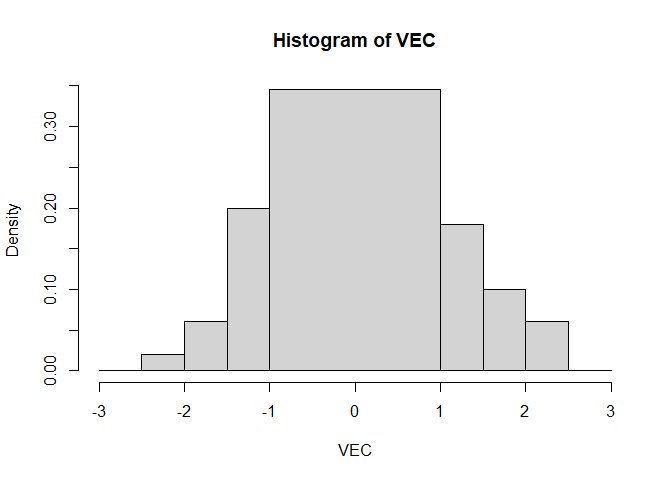
#uneven breaks -> density on y axis
hist(VEC, breaks = c(-3,-2.5,-2,-1.5,-1,1,1.5,2,2.5,3))
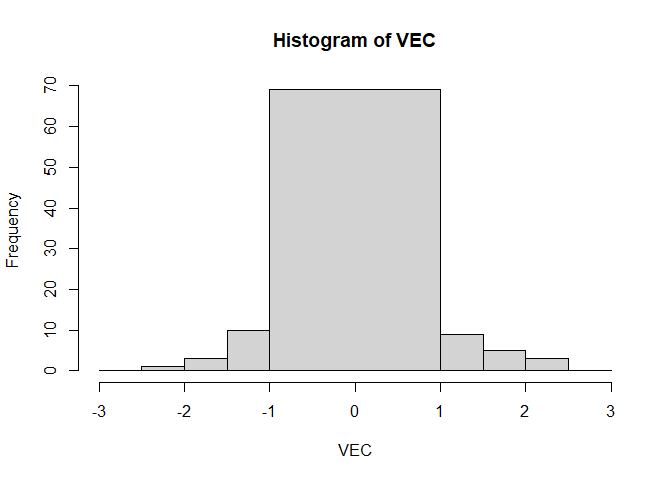
#force frequency
hist(VEC, breaks = c(-3,-2.5,-2,-1.5,-1,1,1.5,2,2.5,3),freq=TRUE)
#> Warning in plot.histogram(r, freq = freq1, col = col, border = border, angle =
#> angle, : the AREAS in the plot are wrong -- rather use 'freq = FALSE'
Created on 2022-11-03 with reprex v2.0.2
1 Like
This topic was automatically closed 42 days after the last reply. New replies are no longer allowed.
If you have a query related to it or one of the replies, start a new topic and refer back with a link.