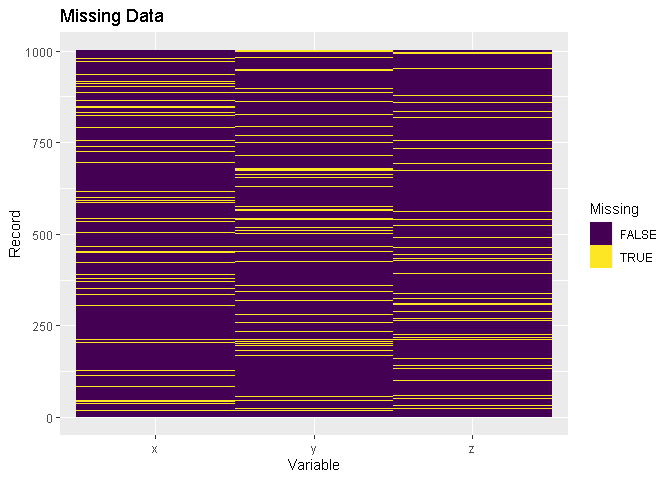
I saw an example of a way to visualize missing data in Python and I thought, how would this work in R? Of course there are several examples, but now there is also this example.
r
library(tidyverse)

# create random data
df <- tibble(
  x = factor(sample(
    x = seq(1,9,1),
    size = 1000,
    replace = TRUE
  )),
  y = factor(sample(
      x = seq(1,9,1),
      size = 1000,
      replace = TRUE
    )),
  z = factor(sample(
    x = seq(1,9,1),
    size = 1000,
    replace = TRUE
  ))
)

df %>%
  mutate(
    id = row_number() # id serves as y value
  ) %>%
  pivot_longer(
    cols = -id,
    names_to = "variable", # serves as x value
    values_to = "value"
  ) %>%
  mutate( # create a new variable for fill
    na_value = na_if(
      x = value,
      y = 9), # in this example, 9 is missing
    isna = is.na(na_value)
  ) %>%
  ggplot(
    mapping = aes(
      x = variable,
      y = id,
      fill = isna
    )
  ) +
  geom_tile() +
  scale_fill_viridis_d() +
  labs(
    title = "Missing Data",
    x = "Variable",
    y = "Record",
    fill = "Missing"
  )
Created on 2022-10-04 with reprex v2.0.2