Hi
Just wondering how I see what the default size, linewidth and width values for each geom?
I'm guessing size relating to points is normally 1.5, and things that relate to linewidth is normally 0.5. But I would like to comfirm.
I'm not sure how width works. Normally 0.9 looks like the default but when x is a date or numeric, 0.9 often does not work
Thanks
mara
September 1, 2022, 11:38am
2
Each Geom has a default_aes field where you can see its defaults, for GeomLine, it's the following:
library(ggplot2)
GeomLine$default_aes
#> Aesthetic mapping:
#> * `colour`    -> "black"
#> * `linewidth` -> 0.5
#> * `linetype`  -> 1
#> * `alpha`     -> NA
Created on 2022-09-01 with reprex v2.0.2
So, the default linewidth is 0.5.
6 Likes
Thanks @mara , that's very helpful
Still confused about width. The help says
This seems to work by providing a width between 0 and 1 most of the time. But when x is a date or continuous variable, it doesn't seem to work.
Any ideas why this might be much appreciated
mara
September 2, 2022, 12:05pm
4
What geom are you looking at? If geom_bar, you might want to look at this FAQ re. spacing and width:
If the behavior is not conforming to the documented behavior, you should create a reprex (short for repr oducible ex ample). It will help us help you if we can be sure we're all working with/looking at the same stuff—and, if it appears to be a bug, it's what's needed to file an issue in the GitHub repo, too.
install.packages("reprex")
If you've never heard of a reprex before, you might want to start by reading the tidyverse.org help page . The reprex dos and don'ts are also useful.
There's a nice FAQ on how to do a minimal reprex for beginners, below:
A minimal reproducible example consists of the following items:
A minimal dataset, necessary to reproduce the issue
The minimal runnable code necessary to reproduce the issue, which can be run
on the given dataset, and including the necessary information on the used packages.
Let's quickly go over each one of these with examples:
For pointers specific to the community site, check out the reprex FAQ .
Hi @mara
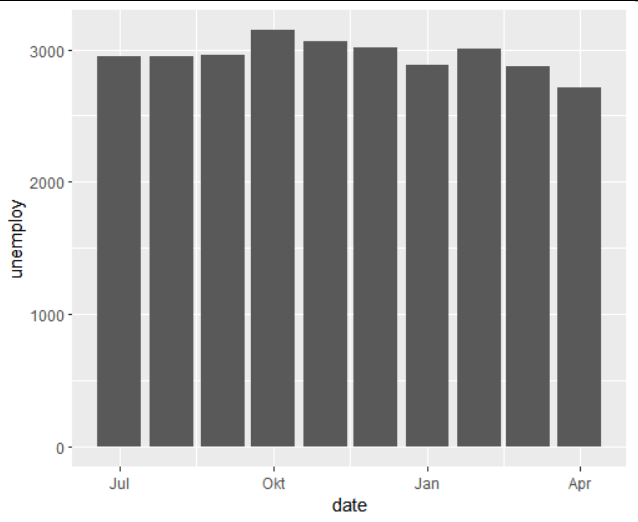
Here is a reprex of width working in a confusing way for a continuous x variable...
library(tidyverse)

economics %>%
  slice_head(n = 10) %>%
  ggplot() +
  geom_col(aes(date, unemploy), width = 0.75)
and x date variable...
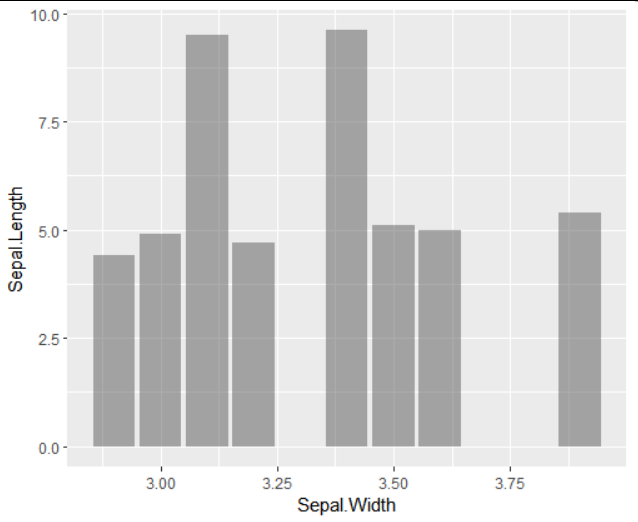
iris %>%
  slice_head(n = 10) %>%
  ggplot() +
  geom_col(aes(Sepal.Width, Sepal.Length), width = 0.75, alpha = 0.5)
I would expect these bar widths to collectively cover 75% of the x scale based on the help.
But that's not what happens. Any ideas much appreciated
As you said it uses 90% of the resolution of the data. Let's boil this down:
Default settings:
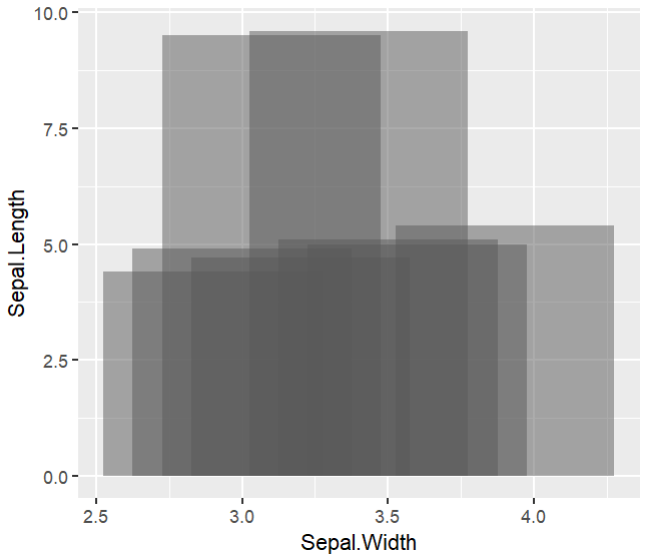
iris %>%
  slice_head(n = 10) %>%
  ggplot() +
  geom_col(aes(Sepal.Width, Sepal.Length), alpha = 0.5)
You have a range of 1 (2.9 - 3.9).
Here a width of 0.09 (equilvalent to 1 / 10 * 0.9) gives the same look.
For the other one a width of 26 comes close to the default:
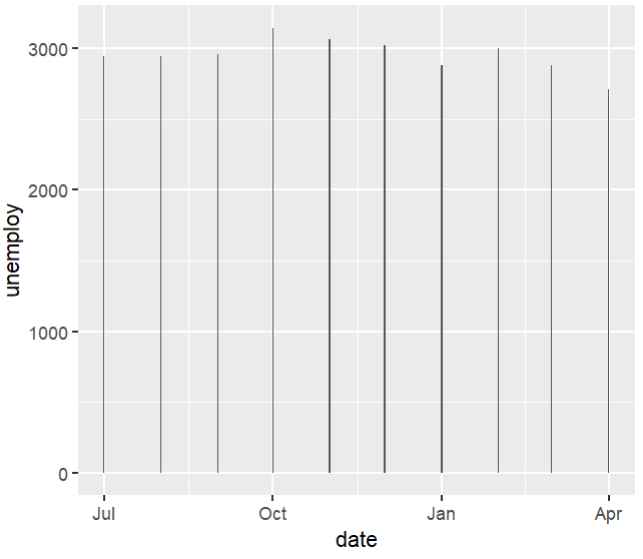
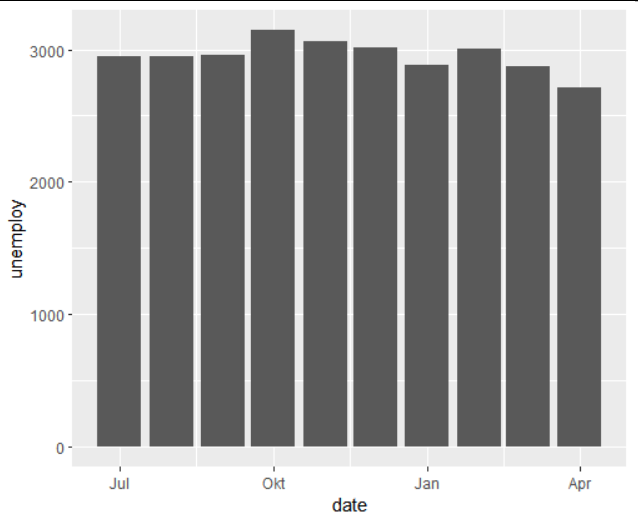
economics %>%
  slice_head(n = 10) %>%
  ggplot() +
  geom_col(aes(date, unemploy), width = 26)
That would represent 29 * 09.
In the end you probably have to guess a bit.
2 Likes
system
September 13, 2022, 7:48am
7
This topic was automatically closed 7 days after the last reply. New replies are no longer allowed.