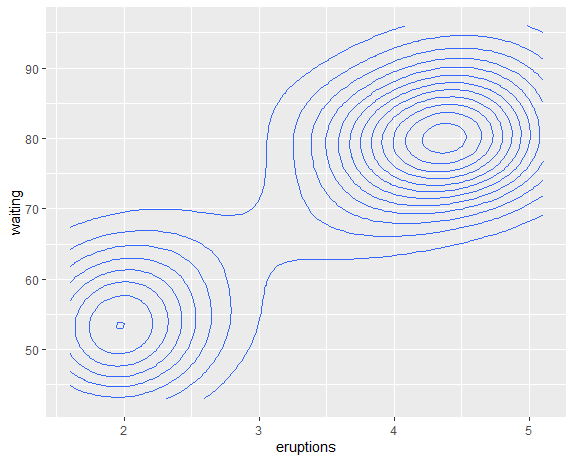
This seems inconsistent with the way the rest of ggplot works when a numeric variable is coloured.
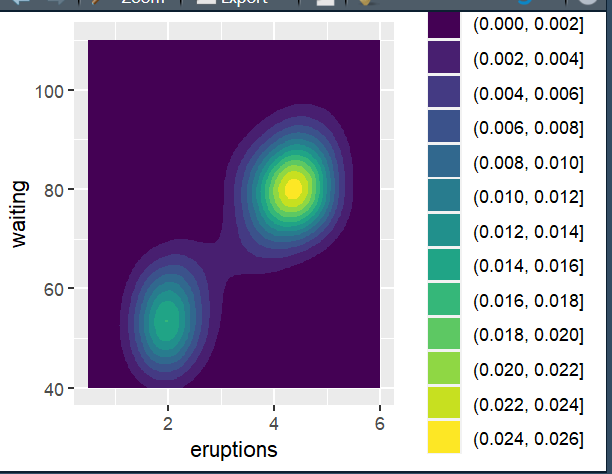
library(tidyverse)
ggplot(faithful, aes(x = eruptions, y = waiting)) +
  geom_density_2d_filled()
This seems inconsistent with the way the rest of ggplot works when a numeric variable is coloured.
library(tidyverse)
ggplot(faithful, aes(x = eruptions, y = waiting)) +
geom_density_2d_filled()
I think it is consistent with the concept of contours, because contours are discrete regions of commonality and I'd expect a discrete scale to accompany that.
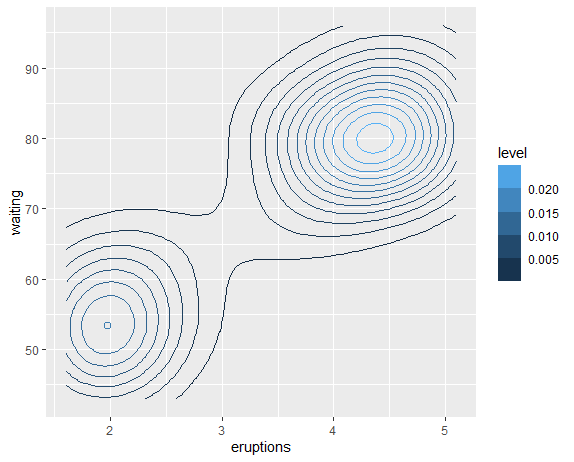
But if you do this...
library(tidyverse)
ggplot(faithful, aes(x = eruptions, y = waiting)) +
  geom_density_2d()
I cant reproduce your image from that code; I see a single common blue color.
Oh sorry, add this to the geom
aes(col = after_stat(level))
source : ggplot2 3.3.0 (tidyverse.org)
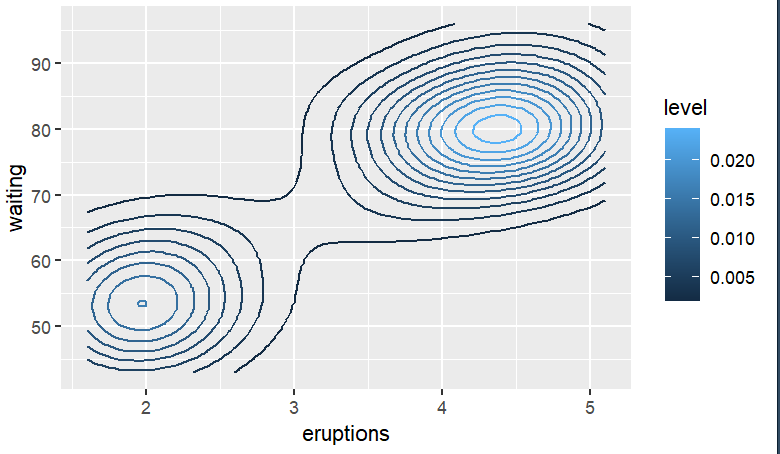
try adding + guides(color=guide_colorsteps())
library(tidyverse)
ggplot(faithful,
       aes(x = eruptions, y = waiting,
           col=after_stat(level))) +
  geom_density_2d() + guides(color=guide_colorsteps())
theres a show.limits = TRUE option you can pass to guide_colorsteps() if you want
This topic was automatically closed 21 days after the last reply. New replies are no longer allowed.
If you have a query related to it or one of the replies, start a new topic and refer back with a link.