I have a 150x3 tibble. Here I leave a head of the table.
| A | B | C |
|---|---|---|
| No | bike | 0 |
| NA | bike | 0 |
| NA | moto | 1 |
| NA | moto | 1 |
| No | car | 0 |
| Yes | NA | 0 |
The values are:
In A, 53 for "No", 41 for "Yes" and 56 NA; in B, 40 for "bike", 33 for "car", 38 for "moto" and 39 NA; in C, 66 for 0, 84 for 1 and 0 NA.
I need to know how to get the p value excluding the NAs, the problem is that I don't know how the packages calculate it. I use 2 packages (tableone) and gt_summary() and none specify.
Also, the 2 packages give me different things and the strange thing is that if I exclude the NA they also continue to give me 2 different things.
Like this:
not excluding NA
With tableone:
df %>%
  CreateTableOne(vars= c("A",
                         "B"),
                 strata= "C",
                 includeNA = T,
                 addOverall = T) %>%
  print(showAllLevels = T,
        explain= F) %>%
  as.data.frame()
| level | Overall | 0 | 1 | p test |
|---|---|---|---|---|
| 150 | 66 | 84 | ||
| No | 53 (35.3) | 21 (31.8) | 32 (38.1) | 0.670 |
| Yes | 41 (27.3) | 20 (30.3) | 21 (25.0) | |
| NA | 56 (37.3) | 25 (37.9) | 31 (36.9) | |
| bike | 40 (26.7) | 20 (30.3) | 20 (23.8) | 0.764 |
| car | 33 (22.0) | 15 (22.7) | 18 (21.4) | |
| moto | 38 (25.3) | 16 (24.2) | 22 (26.2) | |
| NA | 39 (26.0) | 15 (22.7) | 24 (28.6) |
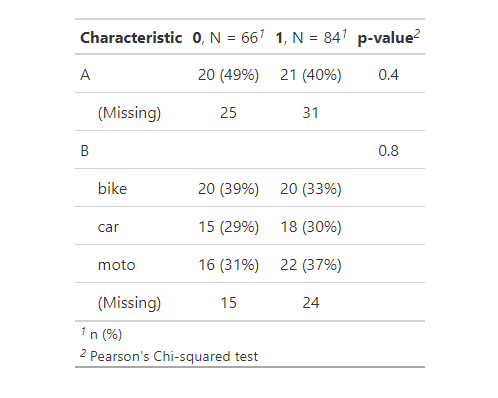
With gt_summary:
df %>%
  tbl_summary(missing_text = "(Missing)",
              missing= "always",
              by= "C") %>%
  add_p()
and now excluding the NA:
With tableone:
df %>%
  filter(!is.na(A) &
           !is.na(B)) %>%
  CreateTableOne(vars= c("A",
                         "B"),
                 strata= "C",
                 includeNA = T,
                 addOverall = T) %>%
  print(showAllLevels = T,
        explain= F) %>%
  as.data.frame()
| level | Overall | 0 | 1 | p test |
|---|---|---|---|---|
| 69 | 32 | 37 | ||
| No | 37 (53.6) | 16 (50.0) | 21 (56.8) | 0.750 |
| Yes | 32 (46.4) | 16 (50.0) | 16 (43.2) | |
| bike | 21 (30.4) | 11 (34.4) | 10 (27.0) | 0.665 |
| car | 23 (33.3) | 9 (28.1) | 14 (37.8) | |
| moto | 25 (36.2) | 12 (37.5) | 13 (35.1) |
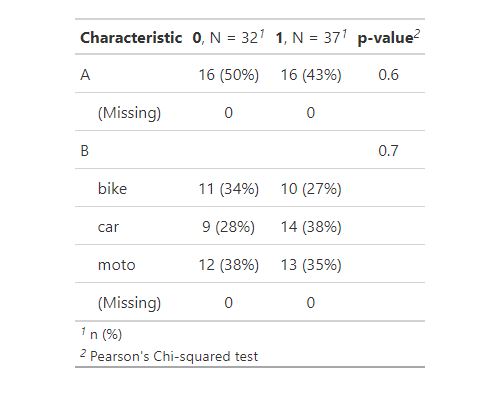
With gt_summary:
df %>%
  filter(!is.na(A) &
           !is.na(B)) %>%
  tbl_summary(missing_text = "(Missing)",
              missing= "always",
              by= "C") %>%
  add_p()
Why does it give me two different values of p value? Why if I exclude the NA it still gives me two different values? Someone could help me?