Dear community
I'm a very newbie who touched R for the first time today.
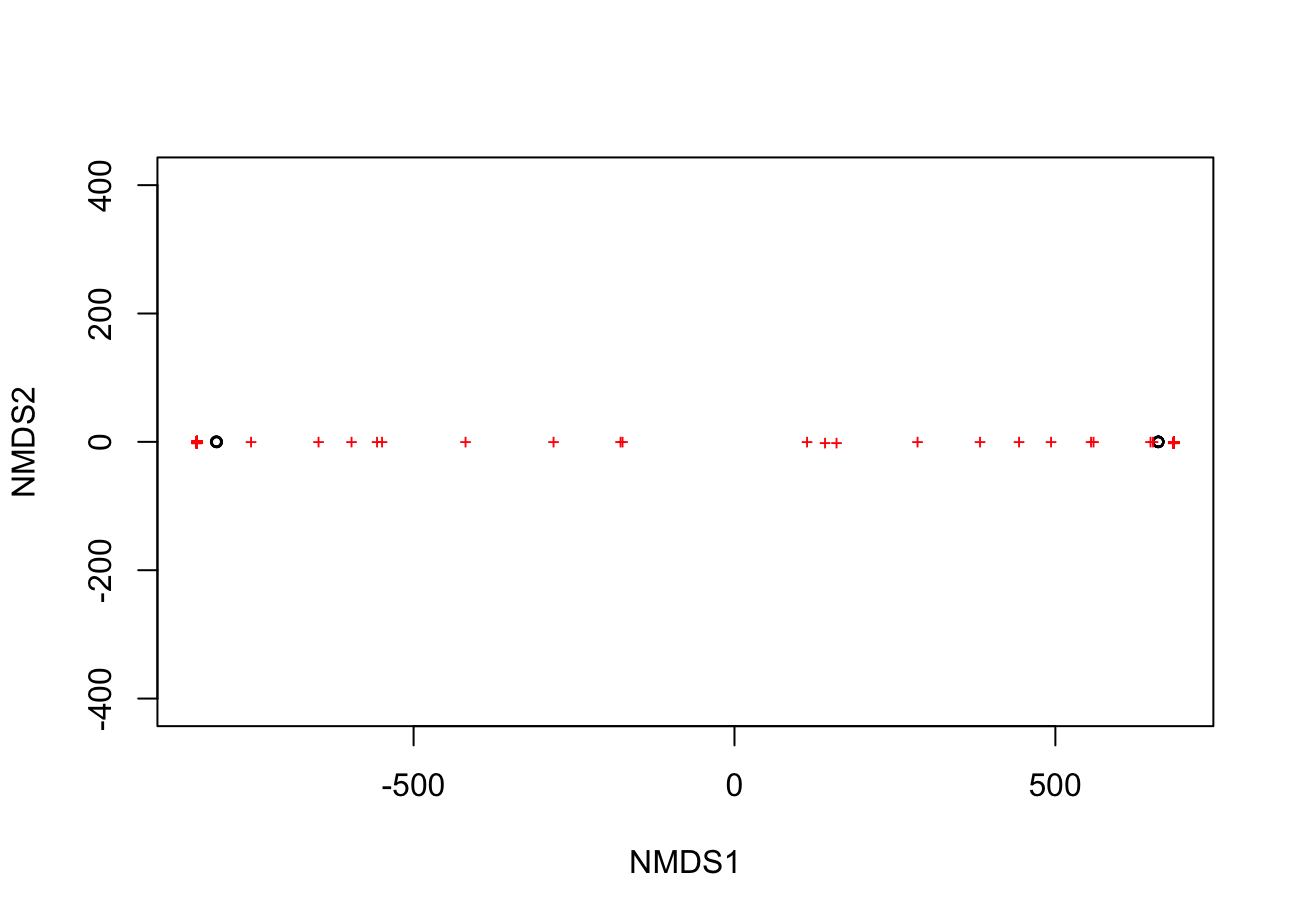
I tried to plot with the following simple code, but the dots are horizontal lines as shown in the image, and I don't know where the problem is.
Could you tell me which codes are the problem, or what codes are missing?
read.csv("microbiome.csv", header = TRUE, row.names = 1)

x = read.csv("microbiome.csv", header = TRUE, row.names = 1)

com = x[,2:ncol(x)]

com[is.na(com)] <- 0

m_com = as.matrix(com)

library("vegan")

nmds = metaMDS(m_com, distance = "bray”)
Can you explain why it shouldnt be like this?, what should it be like ?
Thank you for your prompt reply!
I wanted to analyze seasonal variety of microbiome and expected to be sparsely plotted...
Have you looked at your data to see what numbers are in there ?
もちろんです!
ですが、たった今、なぜこのコードがうまくいかなかったかわかりました。
brayの右のダブルクオーテーションが半角でなく、全角になっておりました。
そのため、R側はまだコードを入力するものと認識し、一向に進まないのだとわかりました。
初心者が些細なことでご迷惑をおかけしました。
最後まで真摯に返信してくださってありがとうございました。
system
Closed
6
This topic was automatically closed 21 days after the last reply. New replies are no longer allowed.
If you have a query related to it or one of the replies, start a new topic and refer back with a link.