I am looking for some suggestions on analyzing wireshark csv data in R. Can you please provide an example to run analysis using source, destination, protocol and time columns?
Thanks
I am looking for some suggestions on analyzing wireshark csv data in R. Can you please provide an example to run analysis using source, destination, protocol and time columns?
Thanks
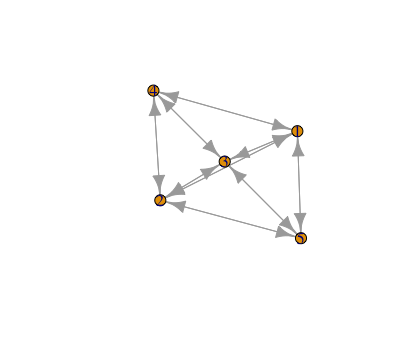
Here's one simple example. Beyond that, ways of analyzing data are potentially unlimited. For example, creating an igraph object of source destination pairs edges with protocol as an attribute and time as an edge and make plots
Thanks for this information. Also, I was looking a sample code for conducting network traffic analysis. I cannot conduct simple descriptive analysis. R continues to report the data needs to be in numeric format.
I find your request for help to be somewhat vague....
Is there some particular chart you want to generate?
some network statistic(s) you want to calculate?
Please provide as much detail as you can about the issue you are wanting to address.
Hi,
I am looking to conduct some basic descriptive statistic analysis and frequencies. I am not looking for present any sort of visual aids. The information analysis could help with incident response and cyber analytics.
Hopes this makes more sense.
do these have names ?
Here is a concrete examples of gathering frequencies , I chose to measure how many times an IP was a source and how many times it was a destination.
library(tidyverse)

# https://www.wireshark.org/docs/wsug_html_chunked/ChIOExportSection.html

csvtext <-'"No.","Time","Source","Destination","Protocol","Length","SSID","Info","Win Size"
"1","0.000000","200.121.1.131","172.16.0.122","TCP","1454","","10554  >  80 [ACK] Seq=1 Ack=1 Win=65535 Len=1400 [TCP segment of a reassembled PDU]","65535"
"2","0.000011","172.16.0.122","200.121.1.131","TCP","54","","[TCP ACKed unseen segment] 80  >  10554 [ACK] Seq=1 Ack=11201 Win=53200 Len=0","53200"
"3","0.025738","200.121.1.131","172.16.0.122","TCP","1454","","[TCP Spurious Retransmission] 10554  >  80 [ACK] Seq=1401 Ack=1 Win=65535 Len=1400 [TCP segment of a reassembled PDU]","65535"
"4","0.025749","172.16.0.122","200.121.1.131","TCP","54","","[TCP Window Update] [TCP ACKed unseen segment] 80  >  10554 [ACK] Seq=1 Ack=11201 Win=63000 Len=0","63000"
"5","0.076967","200.121.1.131","172.16.0.122","TCP","1454","","[TCP Previous segment not captured] [TCP Spurious Retransmission] 10554  >  80 [ACK] Seq=4201 Ack=1 Win=65535 Len=1400 [TCP segment of a reassembled PDU]","65535"'
csvtextfile <- tempfile()
write_lines(csvtext,
                           file=csvtextfile)
(wire_data <- read_csv(file=csvtextfile))

cols_int <- c("Source","Destination")
source_dest_analysis <- pivot_longer(wire_data |> select(all_of(cols_int)),
                                     cols=cols_int,
                                     names_to = "Role",
                                     values_to = "IP") |> arrange(IP,Role)
group_by(source_dest_analysis,
         IP) |> summarise(destination_count = sum(ifelse(Role=="Destination",1,0)),
                          source_count = sum(ifelse(Role=="Source",1,0)))
# A tibble: 2 × 3
  IP            destination_count source_count
  <chr>                     <dbl>        <dbl>
1 172.16.0.122                  3            2
2 200.121.1.131 2 3Yes, I am pulling information from wireshark, and wanted to analysis using R.
I think you didnt understand the question. but ok.
Thank you so much for giving me so many good tips. I am getting errors with select(all_of(cols_int)) statement.
data <- read.csv("network-analysis.csv")
cols_int<- data[c("Source","Destination")]
source_dest_analysis <- pivot_longer(data |> select(all_of(cols_int)),
cols=cols_int,
names_to = "Role",
values_to = "IP") |> arrange(IP,Role)
group_by(source_dest_analysis,
IP) |> summarise(destination_count = sum(ifelse(Role=="Destination",1,0)),
source_count = sum(ifelse(Role=="Source",1,0)))
oh, you added some data[ stuff ...
you shouldnt have ... cols_int was used by me as a way to save repeatedly typing the strings 'Source' and 'Destination' but you made it a data.frame; so either go with my approach; or dont use cols_int
I got it to work. Now, I need to be able to display this information, like for probability or forecasting based on current behavior.
This topic was automatically closed 42 days after the last reply. New replies are no longer allowed.
If you have a query related to it or one of the replies, start a new topic and refer back with a link.