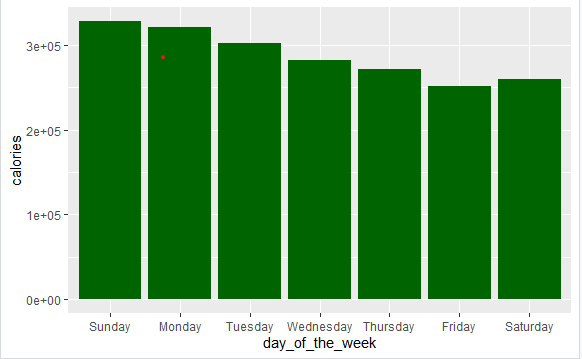
ggplot(daily_activity_new , aes(x = day_of_the_week, y = calories)) + geom_col(fill='dark green')
labs(x = 'Day of week', y = 'Calories burned', title = 'Total calories burned in a week')
on the output, the y-axis values show 3e+05, etc instead of numeric values. Please help as to why this is happening and how can I change it