I am using a base function boxplot in R. When i try "ylab "function and write name I get the wrong label name in y-axis in my boxplot. Please help me. the data is given below:
FOGG
A tibble: 5 × 3
  Pre_fog   Fog Post_fog
    <dbl> <dbl>    <dbl>
1    4.94  5.54     4.86
2    5.24  5.44     4.97
3    4.8   5.32     4.59
4   NA     5.53     4.77
5   NA     5.54    NA
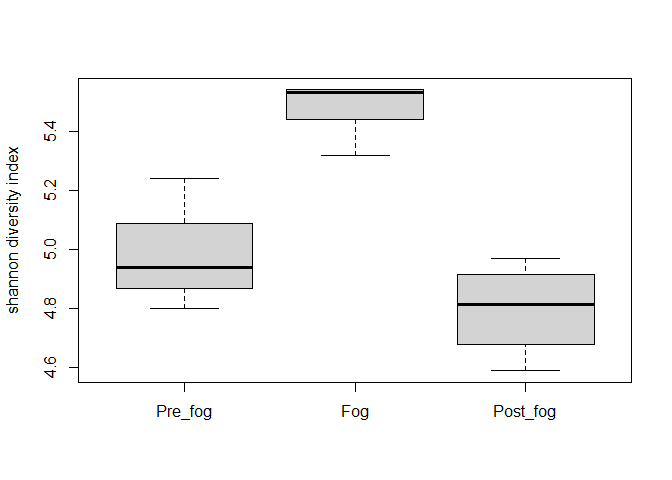
I tried the following code and added ylab= "shannon diversity index". After running the following
boxplot(FOGG, ylab="shannon diversity index"). it shows sharron diversity index on y label.
Pleae help me i am so frustrated.