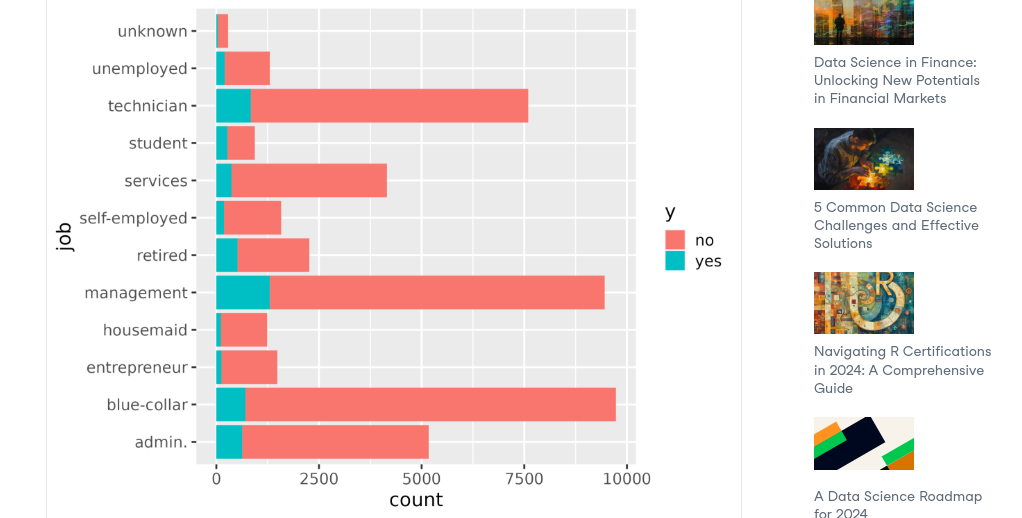
The user_type column has all NA values in the data you posted to I manually filled it. Here is the plot I get.
dataset2 <- structure(list(trip_id = c(21742443, 21742444, 21742445, 21742446,
21742447, 21742448, 21742449, 21742450, 21742451, 21742452, 21742453,
21742454, 21742455, 21742456, 21742457), start_time = c("2019-01-01 0:04:37",
"2019-01-01 0:08:13", "2019-01-01 0:13:23", "2019-01-01 0:13:45",
"2019-01-01 0:14:52", "2019-01-01 0:15:33", "2019-01-01 0:16:06",
"2019-01-01 0:18:41", "2019-01-01 0:18:43", "2019-01-01 0:19:18",
"2019-01-01 0:20:34", "2019-01-01 0:21:52", "2019-01-01 0:23:04",
"2019-01-01 0:23:43", "2019-01-01 0:23:54"), end_time = c("2019-01-01 0:11:07",
"2019-01-01 0:15:34", "2019-01-01 0:27:12", "2019-01-01 0:43:28",
"2019-01-01 0:20:56", "2019-01-01 0:19:09", "2019-01-01 0:19:03",
"2019-01-01 0:20:21", "2019-01-01 0:47:30", "2019-01-01 0:24:54",
"2019-01-01 0:35:20", "2019-01-01 0:32:45", "2019-01-01 0:33:05",
"2019-01-01 0:33:05", "2019-01-01 0:39:00"), bikeid = c(2167,
4386, 1524, 252, 1170, 2437, 2708, 2796, 6205, 3939, 6243, 6300,
3029, 84, 5019), tripduration = c(390, 441, 829, 1783, 364, 216,
177, 100, 1727, 336, 886, 653, 601, 562, 906), from_station_id = c(199,
44, 15, 123, 173, 98, 98, 211, 150, 268, 299, 204, 90, 90, 289
), from_station_name = c("Wabash Ave & Grand Ave", "State St & Randolph St",
"Racine Ave & 18th St", "California Ave & Milwaukee Ave", "Mies van der Rohe Way & Chicago Ave",
"LaSalle St & Washington St", "LaSalle St & Washington St", "St. Clair St & Erie St",
"Fort Dearborn Dr & 31st St", "Lake Shore Dr & North Blvd", "Halsted St & Roscoe St",
"Prairie Ave & Garfield Blvd", "Millennium Park", "Millennium Park",
"Wells St & Concord Ln"), to_station_id = c(84, 624, 644, 176,
35, 49, 49, 142, 148, 141, 295, 420, 255, 255, 324), to_station_name = c("Milwaukee Ave & Grand Ave",
"Dearborn St & Van Buren St ()", "Western Ave & Fillmore St ()",
"Clark St & Elm St", "Streeter Dr & Grand Ave", "Dearborn St & Monroe St",
"Dearborn St & Monroe St", "McClurg Ct & Erie St", "State St & 33rd St",
"Clark St & Lincoln Ave", "Broadway & Argyle St", "Ellis Ave & 55th St",
"Indiana Ave & Roosevelt Rd", "Indiana Ave & Roosevelt Rd", "Stockton Dr & Wrightwood Ave"
), user_type = structure(c(NA_integer_, NA_integer_, NA_integer_,
NA_integer_, NA_integer_, NA_integer_, NA_integer_, NA_integer_,
NA_integer_, NA_integer_, NA_integer_, NA_integer_, NA_integer_,
NA_integer_, NA_integer_), levels = c("customer", "subscriber"
), class = "factor"), gender = c("Male", "Female", "Female",
"Male", "Male", "Female", "Male", "Male", "Male", "Male", "Male",
"Female", "Male", "Female", "Female"), birthyear = c(1989, 1990,
1994, 1993, 1994, 1983, 1984, 1990, 1995, 1996, 1994, 1994, 1986,
1990, 1989), ride_length = c("0:06:30", "0:07:21", "0:13:49",
"0:29:43", "0:06:04", "0:03:36", "0:02:57", "0:01:40", "0:28:47",
"0:05:36", "0:14:46", "0:10:53", "0:10:01", "0:09:22", "0:15:06"
), day_of_week = c(3, 3, 3, 3, 3, 3, 3, 3, 3, 3, 3, 3, 3, 3,
3)), row.names = c(NA, -15L), class = c("tbl_df", "tbl", "data.frame"))
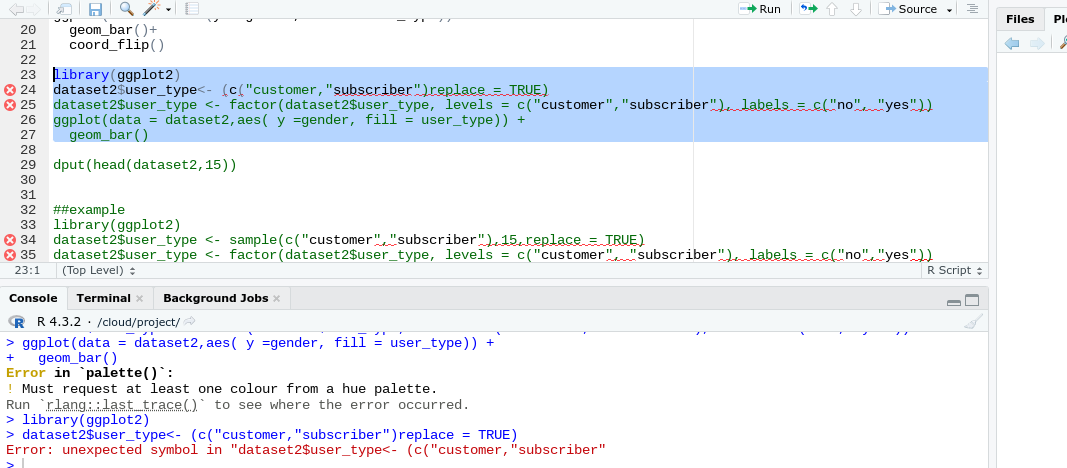
library(ggplot2)
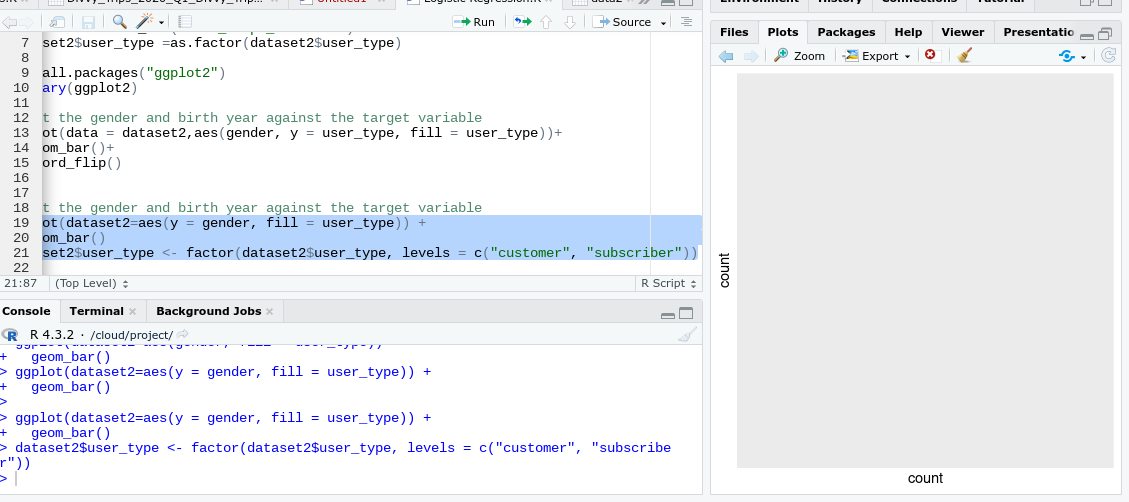
dataset2$user_type <- sample(c("customer","subscriber"),15,replace = TRUE)
dataset2$user_type <- factor(dataset2$user_type, levels = c("customer", "subscriber"), labels = c("no","yes"))
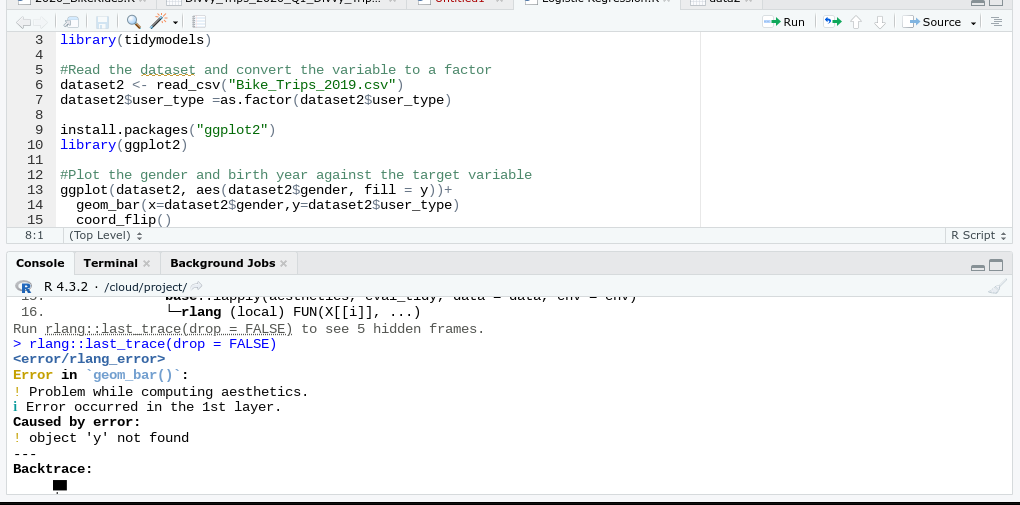
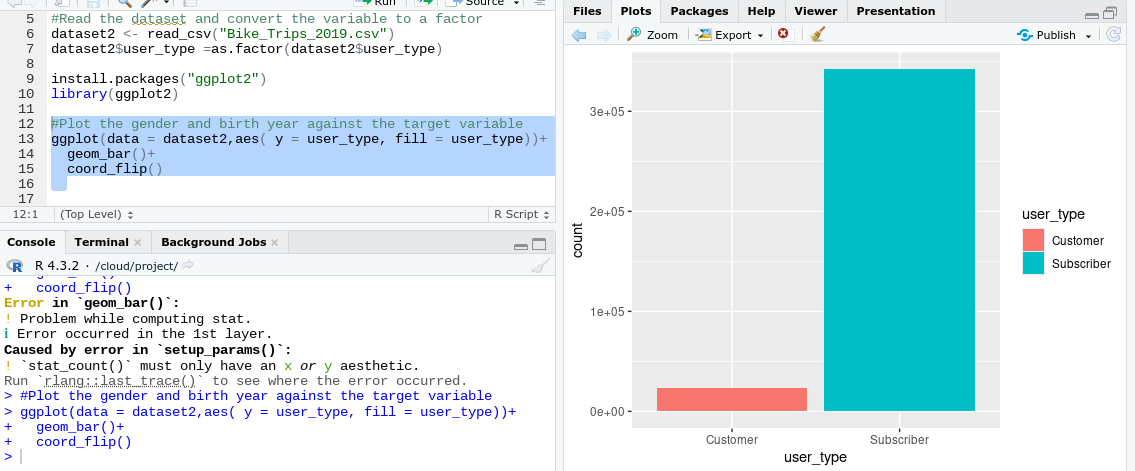
ggplot(data = dataset2,aes( y = gender, fill = user_type))+ geom_bar()

Created on 2024-03-09 with reprex v2.0.2
The image in the last post where you were getting and error shows that you set dataset2=aes() within the ggplot function. That's why you weren't getting a plot.
 <error/tibble_error_assign_incompatible_size>
 Existing data has 365069 rows.
 Only vectors of size 1 are recycled.