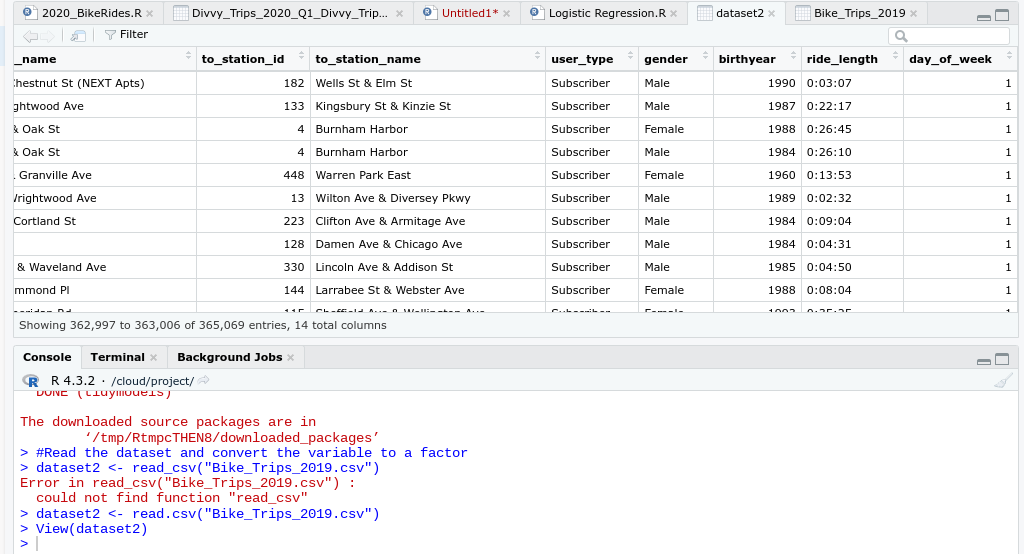
OK no prob, You mean read_csv the dataset?
Its says next to create a training set for fitting the model and test set for model evaluation
Here I have:
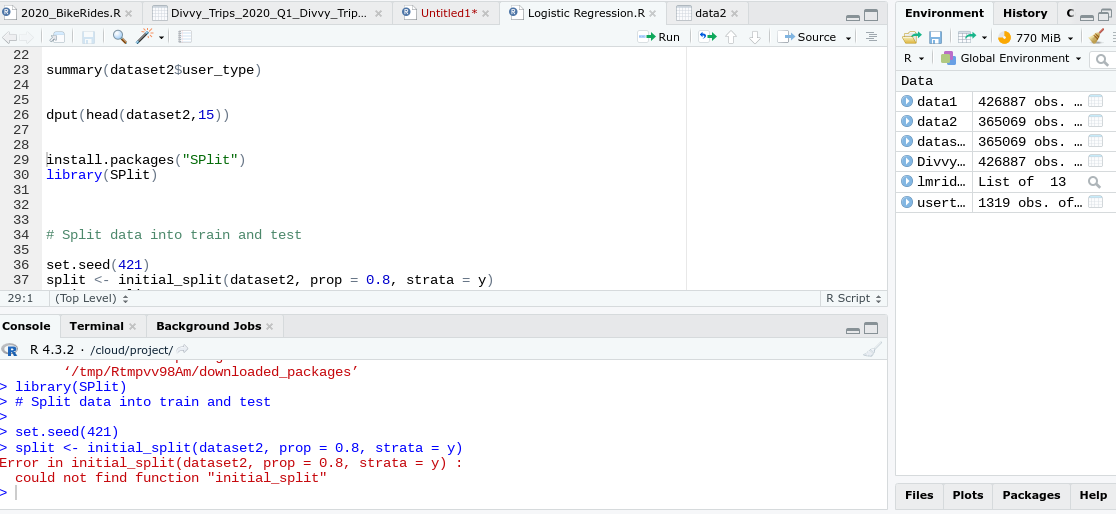
Split data into train and test
set.seed(421)
split <- initial_split(dataset2, prop = 0.8, strata = y)
train <-split %>%
training()
test <- split %>%
testing()
Error message "could not find intial_split finction"
Please see attached screenshot
The function initial_split is part of the rsample package, which is part of the tidymodels bundle of packages. Have you run either library(rsample) or library(tidymodels)?
I ran tidy models at the very beginning but not rsample, one moment I will add that and try again but before I do.
I wanted to manually enter the dataset2$user_type value's. The dataset has 365,069 rows. How would I go about replacing each value instead of the "N/A" ?
Im trying to understand why the values didnt transfer over to R even though they appear here in this chart.
Please see attachment
The value are read in correctly and you probably converted them to NA by using the factor() function and setting the levels incorrectly. I see the value "Subscriber" in your image and in an earlier post you showed code where the factor levels were set to "customer" and "subscriber". Since "Subscriber" matches neither of the levels, it gets converted to NA. Read the data in again and if you convert user_type to a factor, be careful to spell the levels exactly as they appear in the data, including the capitalization.
Ahh I see, got it. Thanks, I will do that next.
Next, I made sure to install the 'rsample' package and tried to run the code to use the initial_split function and ran into a different error:
here is the code:
install.packages("rsample")
library(rsample)
Split data into train and test
set.seed(421)
split <- initial_split(dataset2, prop = 0.8, strata = y)
train <-split %>%
training()
test <- split %>%
testing()
Error:
set.seed(421)
split <- initial_split(dataset2, prop = 0.8, strata = y)
Error inmc_cv():
! Can't subset columns that don't exist.
Column
ydoesn't exist.
Runrlang::last_trace()to see where the error occurred.
I am trying reproduce this graph you did with the correct x and y axis and yes and no labels. I am confused at the code part/
I ran this code:
plot the gender and birth year against the target variable
ggplot(dataset2,aes(gender, fill = user_type)) +
geom_bar()+
coord_flip()
dataset2$user_type <- factor(dataset2$user_type, levels = c("customer", "subscriber"), labels = c("no","yes"))
And this is the plot that was returned.
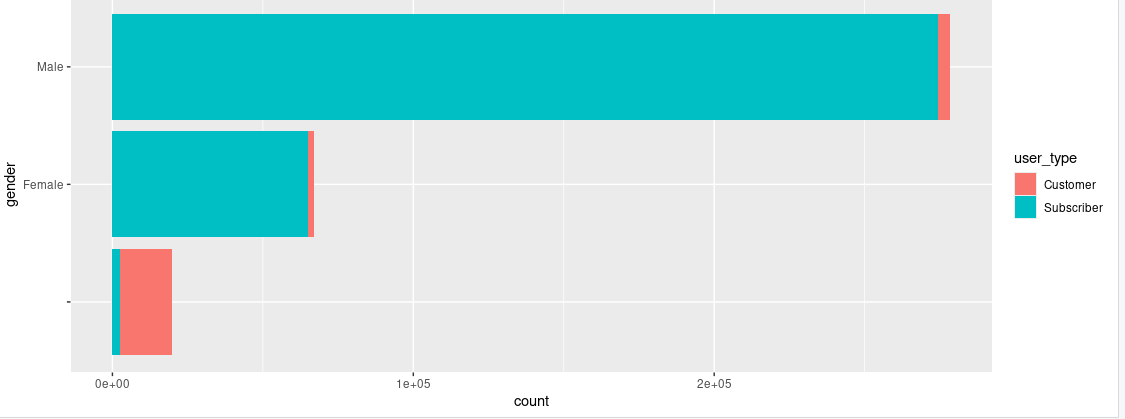
How do I get the yes and no in regards to yes (membership holder/subscriber) + no (customer)?
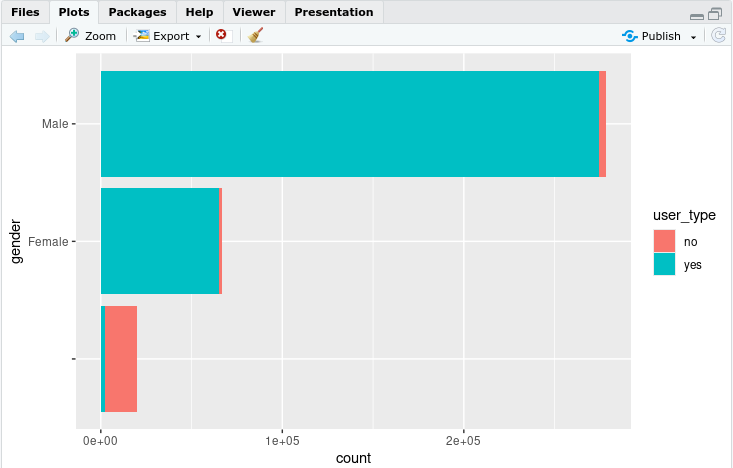
For the yes/no labeling, run the factor function first.
dataset2$user_type <- factor(dataset2$user_type, levels = c("customer", "subscriber"), labels = c("no","yes"))
ggplot(dataset2,aes(gender, fill = user_type)) +
geom_bar()+
coord_flip()
For the error in initial_split(), you have set the argument strata to y but you don't have a column named y. Do you mean user_type?
split <- initial_split(dataset2, prop = 0.8, strata = y)For the plot when I reversed the order, it sent back an error message:
dataset2$user_type <- factor(dataset2$user_type, levels = c("customer", "subscriber"), labels = c("no","yes"))
ggplot(dataset2,aes(gender, fill = user_type)) +
- geom_bar()+
- coord_flip()
Error inpalette():
! Must request at least one colour from a hue palette.
Runrlang::last_trace()to see where the error occurred.
I bet all your user_type values are NA because "customer" and "subscriber" do not match the actual values stored in that column. Run summary(dataset2) to confirm that.
I hadn't previously but I tried assigning y as dataset2$user_type
y <- dataset2$user_type
Split data into train and test
set.seed(421)
split <- initial_split(dataset2, prop = 0.8, strata = y)
train <-split %>%
training()
test <- split %>%
testing()
Returned:
y <- dataset2$user_type
Split data into train and test
set.seed(421)
split <- initial_split(dataset2, prop = 0.8, strata = y)
Error inmc_cv():
! Selections can't have missing values.
Runrlang::last_trace()to see where the error occurred.
Warning message:
Using an external vector in selections was deprecated in tidyselect 1.1.0.
Please use
all_of()orany_of()instead.
Was:
data %>% select(y)
Now:
data %>% select(all_of(y))
See https://tidyselect.r-lib.org/reference/faq-external-vector.html.
This warning is displayed once every 8 hours.
Call lifecycle::last_lifecycle_warnings() to see where this warning was generated.
Oh right sorry you mentioned this earlier, one sec let me change that now and rerun the code
Fixed it, reran original dataset and corrected the capitalization of 'Customer' + 'Subscriber'
plot the gender and birth year against the target variable
dataset2$user_type <- factor(dataset2$user_type, levels = c("Customer", "Subscriber"), labels = c("no","yes"))
ggplot(dataset2,aes(gender, fill = user_type)) +
geom_bar()+
coord_flip()
I wanted to run two other plots this time broken down by 'birthyear' and 'day_of_week'
I ran each code as:
dataset2$user_type <- factor(dataset2$user_type, levels = c("Customer", "Subscriber"), labels = c("no","yes"))
ggplot(dataset2,aes(birthyear, fill = user_type)) +
geom_bar()+
coord_flip()
dataset2$user_type <- factor(dataset2$user_type, levels = c("Customer", "Subscriber"), labels = c("no","yes"))
ggplot(dataset2,aes(day_of_week, fill = user_type)) +
geom_bar()+
coord_flip()
Received an error message
dataset2$user_type <- factor(dataset2$user_type, levels = c("Customer", "Subscriber"), labels = c("no","yes"))
ggplot(dataset2,aes(birthyear, fill = user_type)) +
- geom_bar()+
- coord_flip()
Error inpalette():
! Must request at least one colour from a hue palette.
Runrlang::last_trace()to see where the error occurred.
Warning message:
Removed 18023 rows containing non-finite outside the scale
range (stat_count()).
dataset2$user_type <- factor(dataset2$user_type, levels = c("Customer", "Subscriber"), labels = c("no","yes"))
ggplot(dataset2,aes(day_of_week, fill = user_type)) +
- geom_bar()+
- coord_flip()
Error inpalette():
! Must request at least one colour from a hue palette.
Don't run the factor function multiple times on the same column. Run it once to make user_type a factor before you make any plots.
Here is a toy example of how running it twice will convert the column to NA.
DF <- data.frame(A = c("Customer", "Subscriber"))
DF$A <-  factor(DF$A, levels = c("Customer", "Subscriber"), labels = c("no","yes"))
DF
    A
1  no
2 yes
DF$A <-  factor(DF$A, levels = c("Customer", "Subscriber"), labels = c("no","yes"))
DF
     A
1 <NA>
2 <NA>
1 Like
Ah I see, so if I want to use the factor again but to see a different variable should I open up another tab?
For instance, I believe for the purpose of measuring ride_lengths per user_type and their different attributes, I would need to rerun this code but swap out dataset2$user_type for dataset2$ride_length
How do I do that with out converting the column to NA ?
I was able to run the code again to see the breakdown by birth year here:
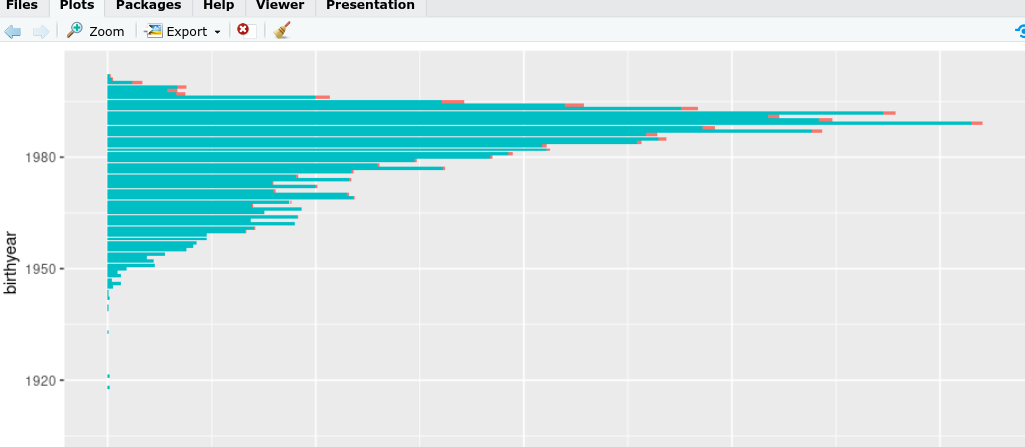
It's just missing the mapkey.
** Correction it has the 'Customer' + 'Subscriber' labels, it was just cut off of the screen. **
I'm confused about what you are confused about. If you want user_type to display as yes and no, run this code once
dataset2$user_type <- factor(dataset2$user_type, levels = c("Customer", "Subscriber"), labels = c("no","yes"))
The code stores the changed user_type values in dataset2. Any plotting done after that using dataset2 will see that user_type is a factor. None of the plotting functions will affect the nature of user_type in dataset2. I don't see why plotting ride_length for the two user_type populations would make either column into NA values. Can you show the code?
Sure, I ran the code as:
dataset2$ride_length <- factor(dataset2$ride_length, levels = c("Customer", "Subscriber"),labels = c("no", "yes"))
ggplot(dataset2,aes(gender, fill = user_type))+
geom_bar()+
coord_flip()+
Error message is the same:
Error in palette():
! Must request at least one colour from a hue
palette.
Run rlang::last_trace() to see where the error occurred.
coord_flip() corrected to not include + symbol